Fig. 3.

Download original image
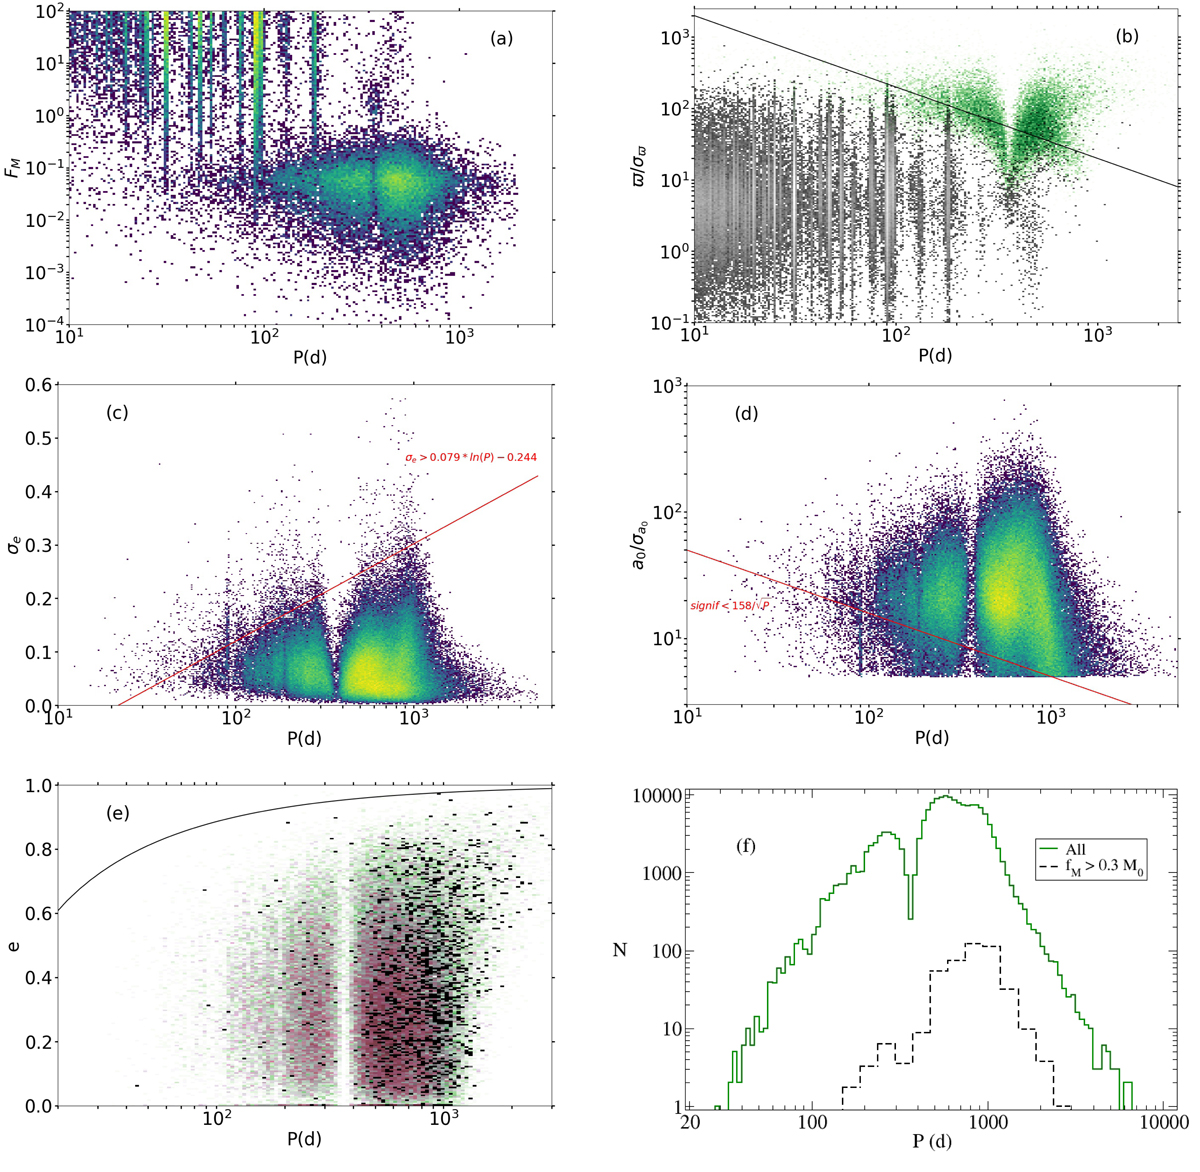
Selection of the astrometric orbital solutions. The first row refers to the solution obtained from a processing trial without the selection based on parallax error. (a): period vs. mass function diagram, showing a clump of plausible solutions, bounded by fM ≈ 0.3 M⊙, and various sequences, organised around particular periods, which cross the clump and extend well beyond. (b): period vs. ‘parallax significance’. The solutions with fM < 0.3 M⊙ are in green, and the large fM, which are well clustered around the same periods as in panel (a), are in black. The line is the limit ϖ/σϖ = 20 000/Pd, which was implemented in the main processing to discard the dubious solutions. The second row shows the density map diagrams used to set up the post-processing filters to remove the concentrations still existing over specific periods. (c): period–eccentricity uncertainty diagram; solutions above the red line were rejected. (d): period–significance diagram; solutions below the red line were rejected. The third row shows properties of the DR3 solutions eventually selected after applying the post-processing filters. (e): the period–eccentricity diagram; the black curve is the maximum eccentricity assuming that the periods shorter than 10 days are circularised. The black dots are the solutions with fM > 0.3 M⊙. The astrometric-only orbital solutions are in green, while the solutions confirmed by a spectroscopic SB1 orbit from Gaia are in purple. (f): histogram of periods; the proportion of solutions with mass function above 0.3 solar masses, in black, increases with period, as the gap between these solutions and the totality, in green, is reduced (in order to highlight possible overdensities, the step size of the green histogram is very fine; to avoid fluctuations in counts from small numbers, the black histogram was plotted by merging the count intervals into clusters of four, and giving the mean value for each cluster).
Current usage metrics show cumulative count of Article Views (full-text article views including HTML views, PDF and ePub downloads, according to the available data) and Abstracts Views on Vision4Press platform.
Data correspond to usage on the plateform after 2015. The current usage metrics is available 48-96 hours after online publication and is updated daily on week days.
Initial download of the metrics may take a while.


