Fig. 2.

Download original image
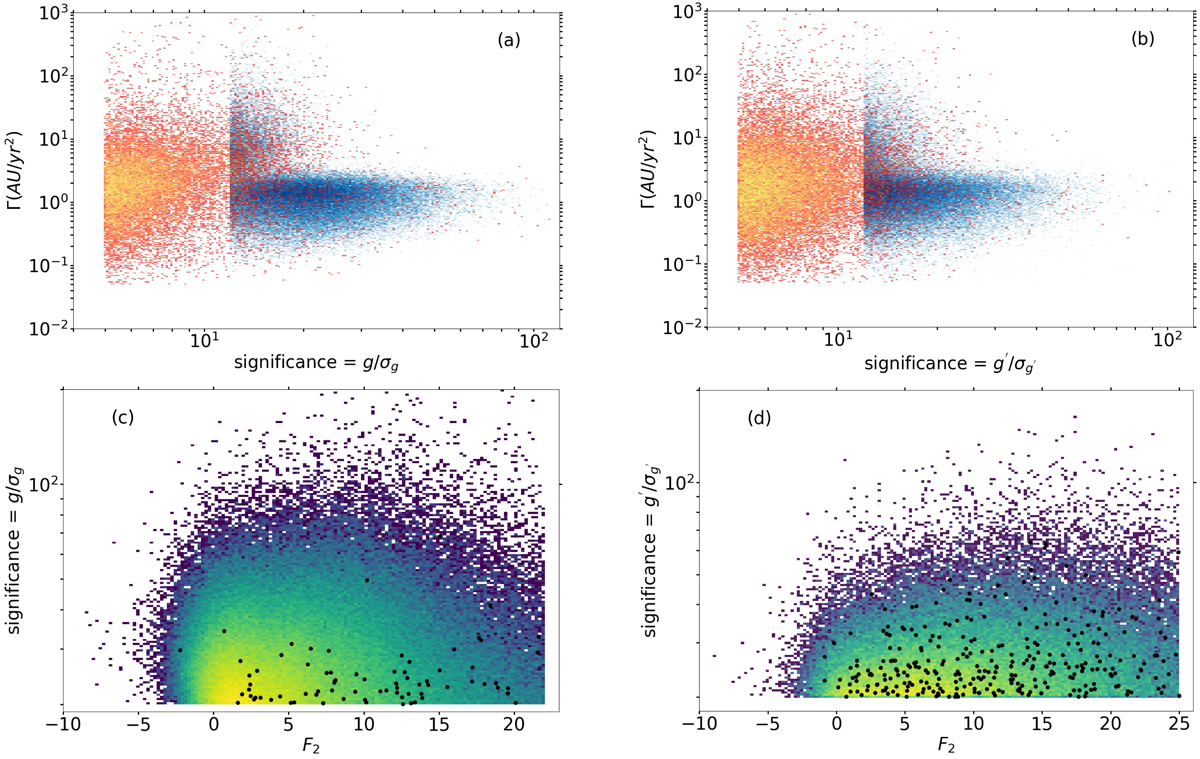
Selection of the acceleration solutions. The left-hand panels correspond to solutions with constant acceleration, and those on the right to those with variable acceleration. Panels (a) and (b): significance vs. acceleration diagrams from a processing trial without the selection based on parallax error. The solutions with F2 below the final threshold are in blue, while those above are in orange. The solutions of 5 < s < 12 were accepted in the absence of better solutions from another model, while the others were immediately accepted when s > 12 and F2 was below 22 (for constant acceleration solutions) or 25 (for variable acceleration solutions). The number of solutions with a mean acceleration Γ > 3 au yr−2 falls off when the significance exceeds 20. Panels (c) and (d): the F2 vs. s diagrams of the solutions finally selected in the post-processing. The black dots are the remaining solutions with Γ > 3 au yr−2; they still correspond to the smallest significances, but this is essentially due to the filtering based on the parallax error.
Current usage metrics show cumulative count of Article Views (full-text article views including HTML views, PDF and ePub downloads, according to the available data) and Abstracts Views on Vision4Press platform.
Data correspond to usage on the plateform after 2015. The current usage metrics is available 48-96 hours after online publication and is updated daily on week days.
Initial download of the metrics may take a while.


