Open Access
Fig. 7.
Download original image
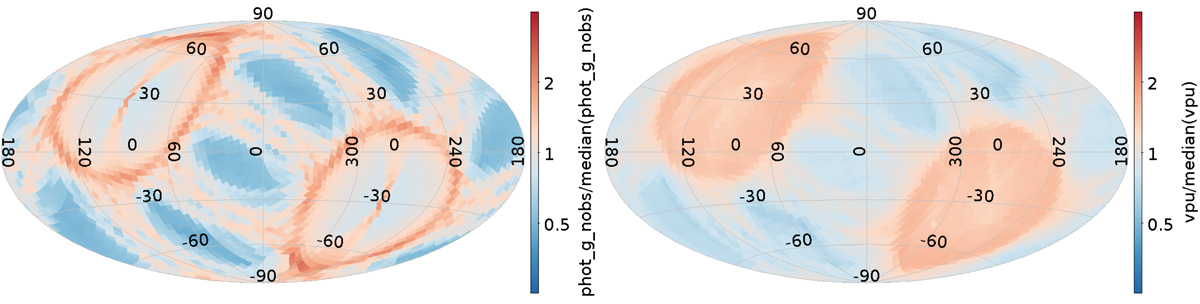
Ratio of the number of photometric observations over their median values for G < 18 (left) and the ratio of the number of visibility periods used in astrometry over their median values for G < 15 (right), with the same colour scale (from ![]() to 4) as Fig. 6.
to 4) as Fig. 6.
Current usage metrics show cumulative count of Article Views (full-text article views including HTML views, PDF and ePub downloads, according to the available data) and Abstracts Views on Vision4Press platform.
Data correspond to usage on the plateform after 2015. The current usage metrics is available 48-96 hours after online publication and is updated daily on week days.
Initial download of the metrics may take a while.