Fig. 5.
Download original image
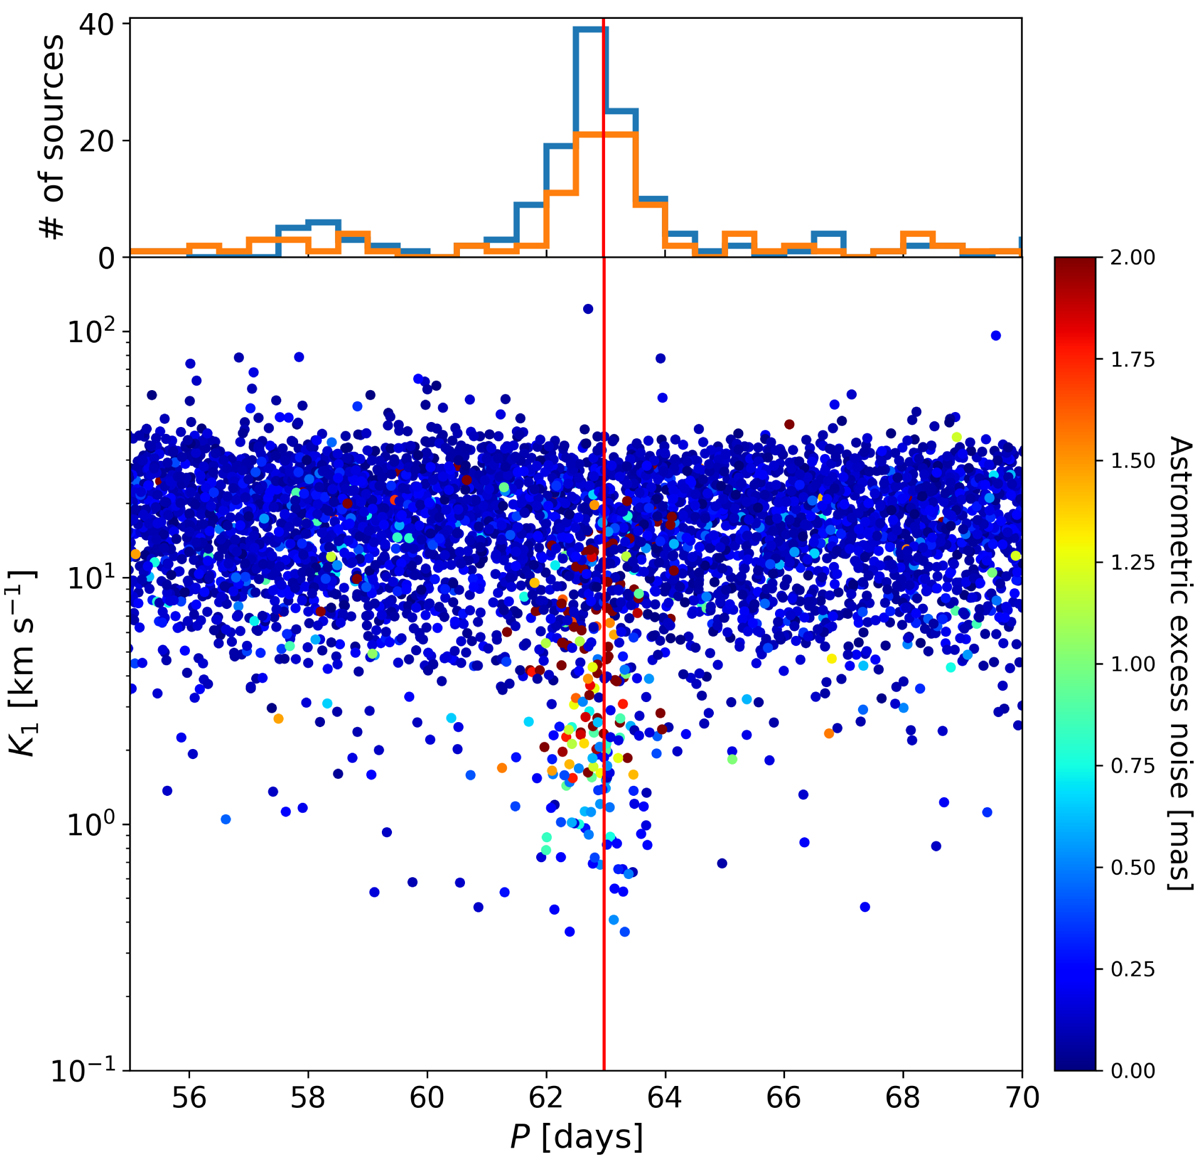
K1 semi-amplitude vs. period diagram of SB1 solutions, colour coded according to their astrometric_excess_noise. The diagram shows the presence of an overdensity of solutions at periods near the precession period (marked with a vertical line) with large astrometric excess noise. The histogram at the top shows the density of solutions with astrometric excess noise larger than 1 mas (blue line) and of those with ipd_frac_multi_peak > 20 (orange line).
Current usage metrics show cumulative count of Article Views (full-text article views including HTML views, PDF and ePub downloads, according to the available data) and Abstracts Views on Vision4Press platform.
Data correspond to usage on the plateform after 2015. The current usage metrics is available 48-96 hours after online publication and is updated daily on week days.
Initial download of the metrics may take a while.