Fig. 43.
Download original image
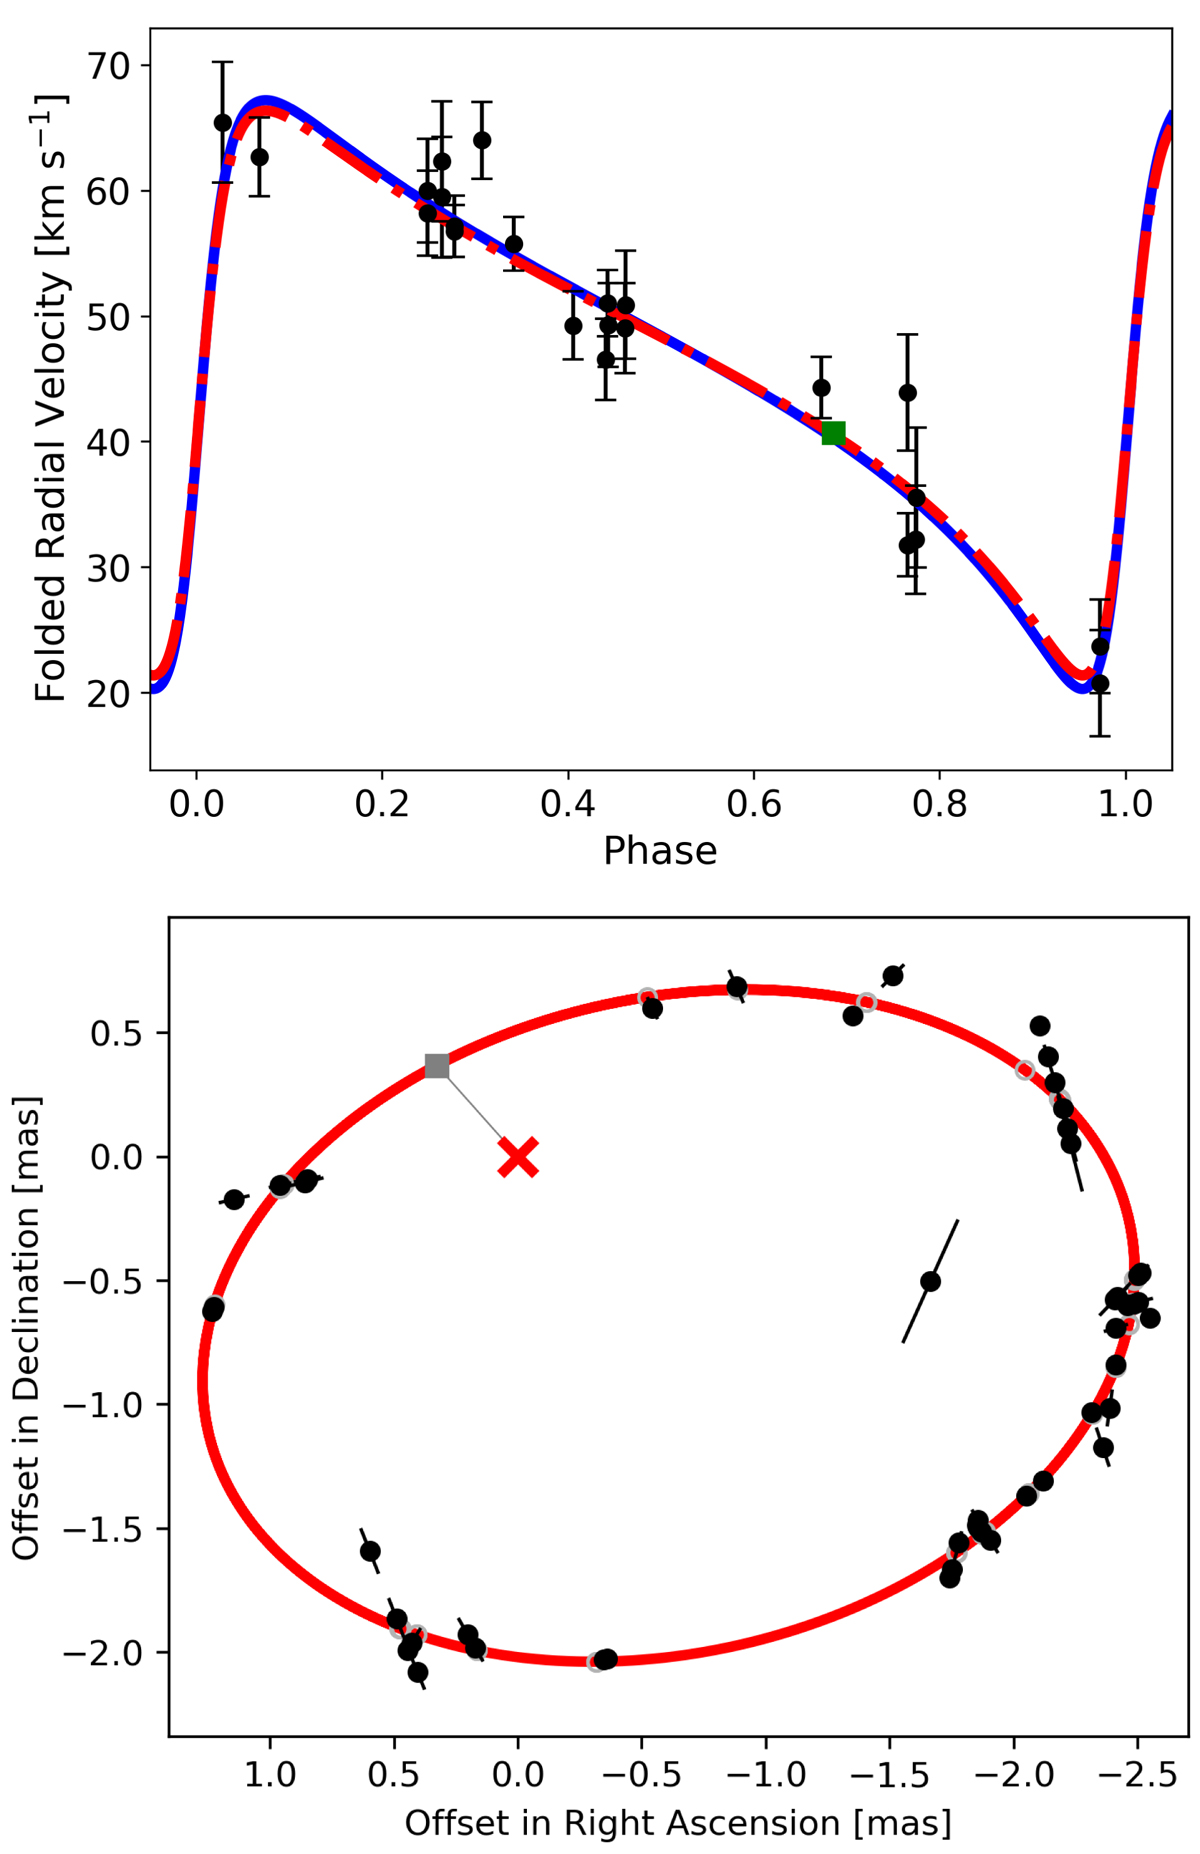
Top panel: phase-folded radial velocity data of Gaia DR3 5136025521527939072, together with the orbits using the astrometric (red dot-dashed line) and spectroscopic (blue solid line) orbital elements separately; the OHP/Sophie external measurement (green squared point) was not part of the fit. Bottom panel: along-scan residuals of the mean epoch astrometric measurements (black symbols) relative to the model positions (grey circles) and the astrometric orbit (red solid line) of the same source. The red cross marks the focus of the orbit and the grey square is the periastron location.
Current usage metrics show cumulative count of Article Views (full-text article views including HTML views, PDF and ePub downloads, according to the available data) and Abstracts Views on Vision4Press platform.
Data correspond to usage on the plateform after 2015. The current usage metrics is available 48-96 hours after online publication and is updated daily on week days.
Initial download of the metrics may take a while.