Open Access
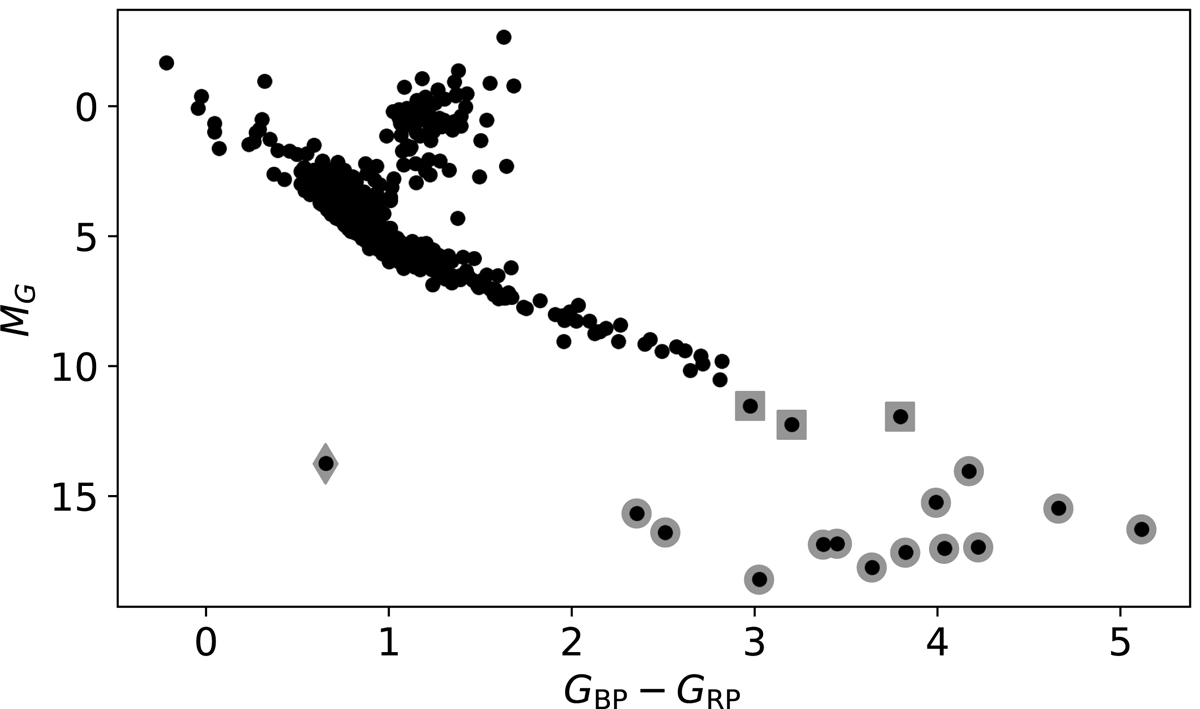
Fig. 31.
Download original image
Colour–magnitude diagram of 533 sources with OrbitalTargetedSearch* solutions (black circles). The larger grey circles indicate sources that are listed in the GUCD sample (Smart et al. 2019), the grey squares indicate red sources discussed in the text, and the diamond indicates the WD discussed in Sect. 8.8.
Current usage metrics show cumulative count of Article Views (full-text article views including HTML views, PDF and ePub downloads, according to the available data) and Abstracts Views on Vision4Press platform.
Data correspond to usage on the plateform after 2015. The current usage metrics is available 48-96 hours after online publication and is updated daily on week days.
Initial download of the metrics may take a while.