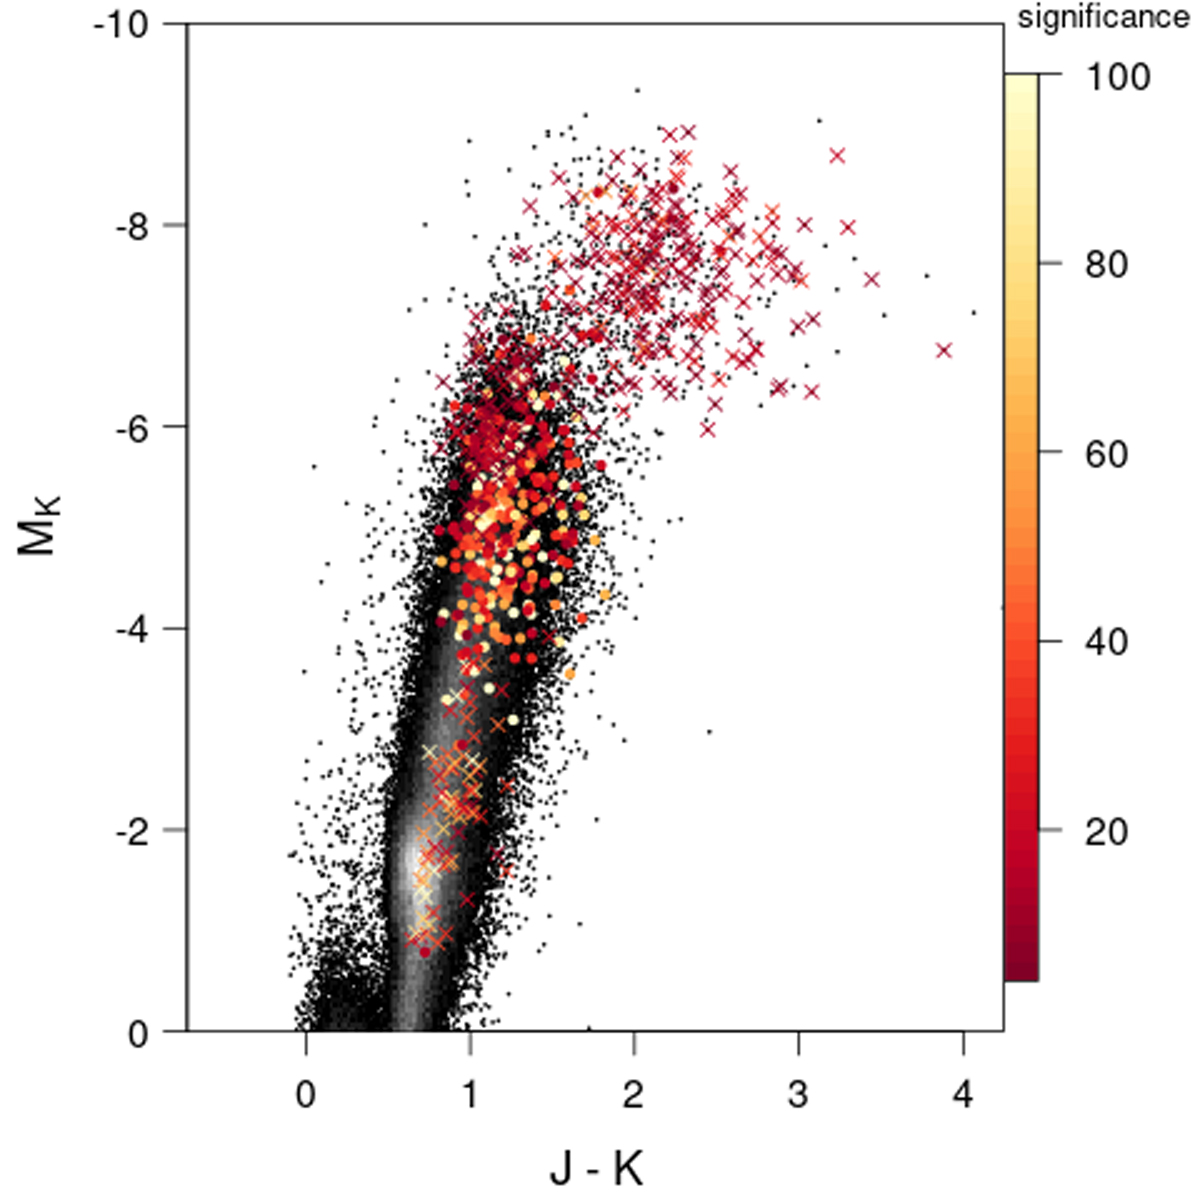
Fig. 27.
Download original image
Location in the infrared colour–magnitude diagram of the stars with 0.45 ≤ Plpv/Pnss ≤ 0.55 (ellipsoidal variables) from Table 6 (dots). Stars with 0.95 ≤ Plpv/Pnss ≤ 1.05 are represented by crosses; they appear in two different locations, among LPVs with low orbital significance on one hand, and among less luminous giants with much larger orbital significance on the other, perhaps suggesting starspot modulation or short-period pulsators. The dots (Plpv/Pnss ∼ 0.5) fall in between these two groups, as they are located just below the tip of the RGB.
Current usage metrics show cumulative count of Article Views (full-text article views including HTML views, PDF and ePub downloads, according to the available data) and Abstracts Views on Vision4Press platform.
Data correspond to usage on the plateform after 2015. The current usage metrics is available 48-96 hours after online publication and is updated daily on week days.
Initial download of the metrics may take a while.