Open Access
Fig. 25.
Download original image
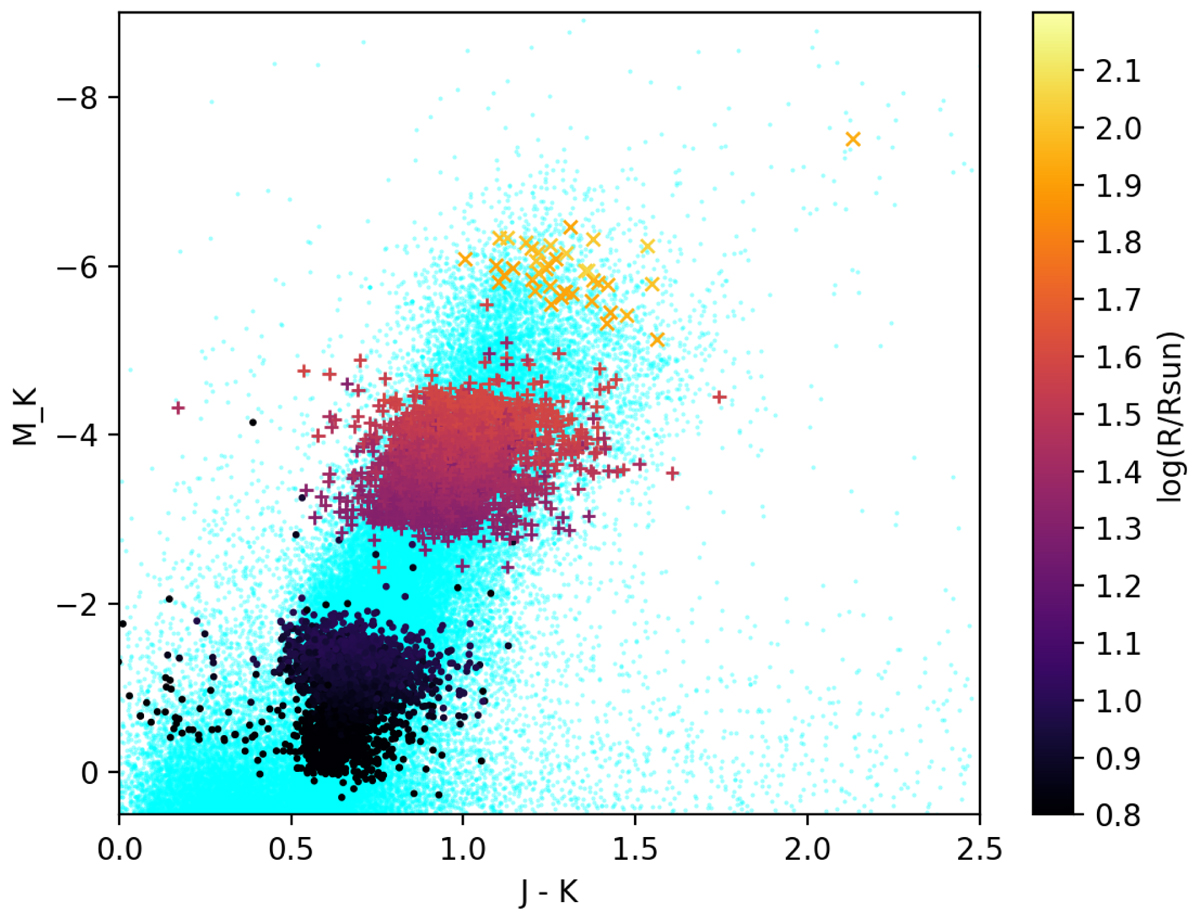
Location in the HRD of three among the samples displayed in Fig. 24, namely 0.7 < log(R/R⊙)≤1.0 (dots), 1.3 < log(R/R⊙)≤1.6 (plus symbols), and 1.9 < log(R/R⊙) (crosses). Small cyan dots correspond to the SB1 not selected by our selection criteria. See Table 5 for a full discussion of the properties of the yellow crosses.
Current usage metrics show cumulative count of Article Views (full-text article views including HTML views, PDF and ePub downloads, according to the available data) and Abstracts Views on Vision4Press platform.
Data correspond to usage on the plateform after 2015. The current usage metrics is available 48-96 hours after online publication and is updated daily on week days.
Initial download of the metrics may take a while.