Fig. 24.
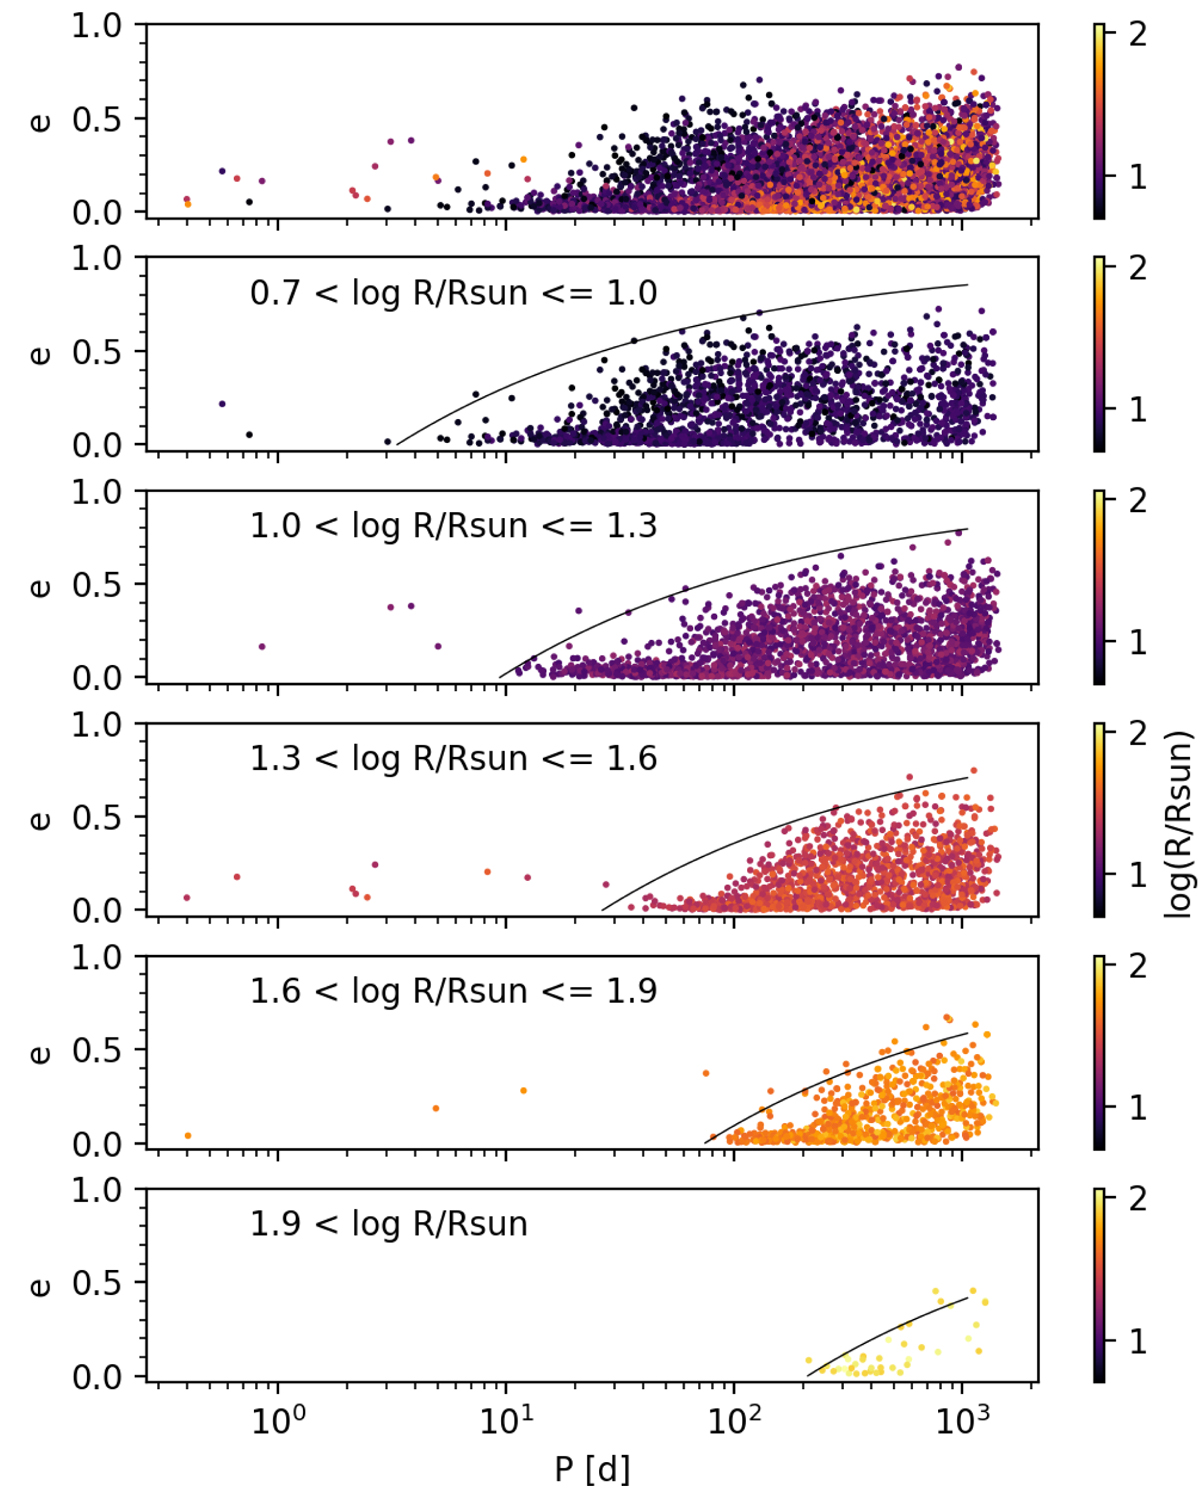
Download original image
e − P diagram for SB1 systems along the giant branch, filtered according to significance factors larger than 40, for various radius spans. Top panel: is the full sample. The solid black lines correspond to the loci where P(1 − e)3 is constant (see text). The sample sizes are, from top to bottom, 1960, 2358, 1643, 737, and 40. The location in the HRD of the SB1 systems with 0.7 < log(R/R⊙)≤1.0 (second panel from top), 1.3 < log(R/R⊙)≤1.6 (fourth panel from top) and 1.9 < log(R/R⊙) (bottom panel) is shown in Fig. 25.
Current usage metrics show cumulative count of Article Views (full-text article views including HTML views, PDF and ePub downloads, according to the available data) and Abstracts Views on Vision4Press platform.
Data correspond to usage on the plateform after 2015. The current usage metrics is available 48-96 hours after online publication and is updated daily on week days.
Initial download of the metrics may take a while.