Fig. 21.
Download original image
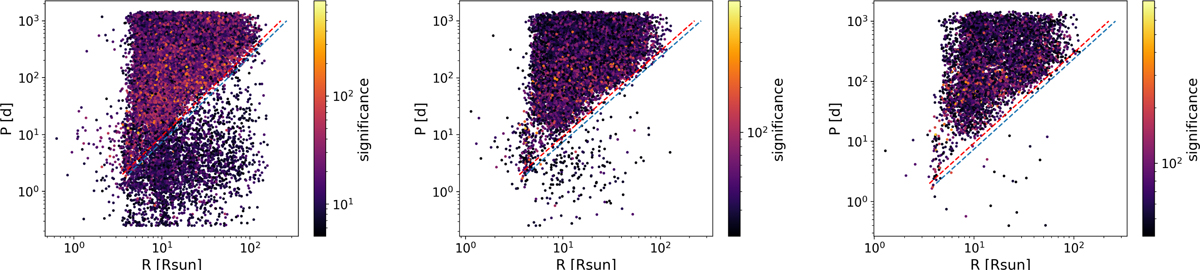
Period–radius diagram for all SB1 solutions falling along the RGB and AGB according to criterion (5), and with a radius available from radius_flame. The dashed lines correspond to the threshold periods expressed by Eq. (7) for ℳ1 = 1.3 ℳ⊙ and ℳ2 = 1.0 ℳ⊙ (red dashed line) and ℳ1 = 1.3 ℳ⊙ and ℳ2 = 0.2 ℳ⊙ (cyan dashed line). Left (a): unfiltered, 44 706 SB1 solutions (among which 3056 unphysical, that is, below the cyan dashed line). Middle (b): filtered by significance K1/σK1 > 20, 27 404 solutions are rejected and 17 302 are kept (among which 214 unphysical). Right (c): filtered by significance > 40, 37 850 solutions are rejected and 6856 are kept (among which 21 unphysical).
Current usage metrics show cumulative count of Article Views (full-text article views including HTML views, PDF and ePub downloads, according to the available data) and Abstracts Views on Vision4Press platform.
Data correspond to usage on the plateform after 2015. The current usage metrics is available 48-96 hours after online publication and is updated daily on week days.
Initial download of the metrics may take a while.