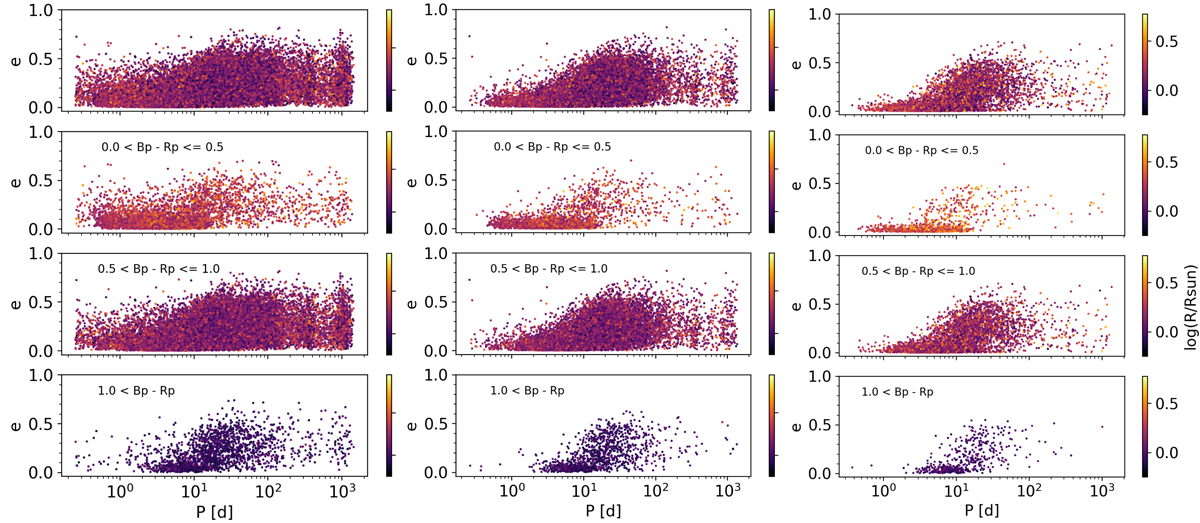
Fig. 20.
Download original image
The e − P diagram for SB1s along the main sequence, filtered according to significance factors larger than 10, 20, or 40 (from left to right), and for different (GBP, 0 − GRP, 0) spans (top to bottom). Filtering on the significance removes potentially spurious high-eccentricity solutions at small periods with the side effect of removing long period solutions. The drop in the number of systems at P = 0.5 yr due to insufficient sampling at this specific period. The color codes for the FLAME radius estimate.
Current usage metrics show cumulative count of Article Views (full-text article views including HTML views, PDF and ePub downloads, according to the available data) and Abstracts Views on Vision4Press platform.
Data correspond to usage on the plateform after 2015. The current usage metrics is available 48-96 hours after online publication and is updated daily on week days.
Initial download of the metrics may take a while.