Open Access
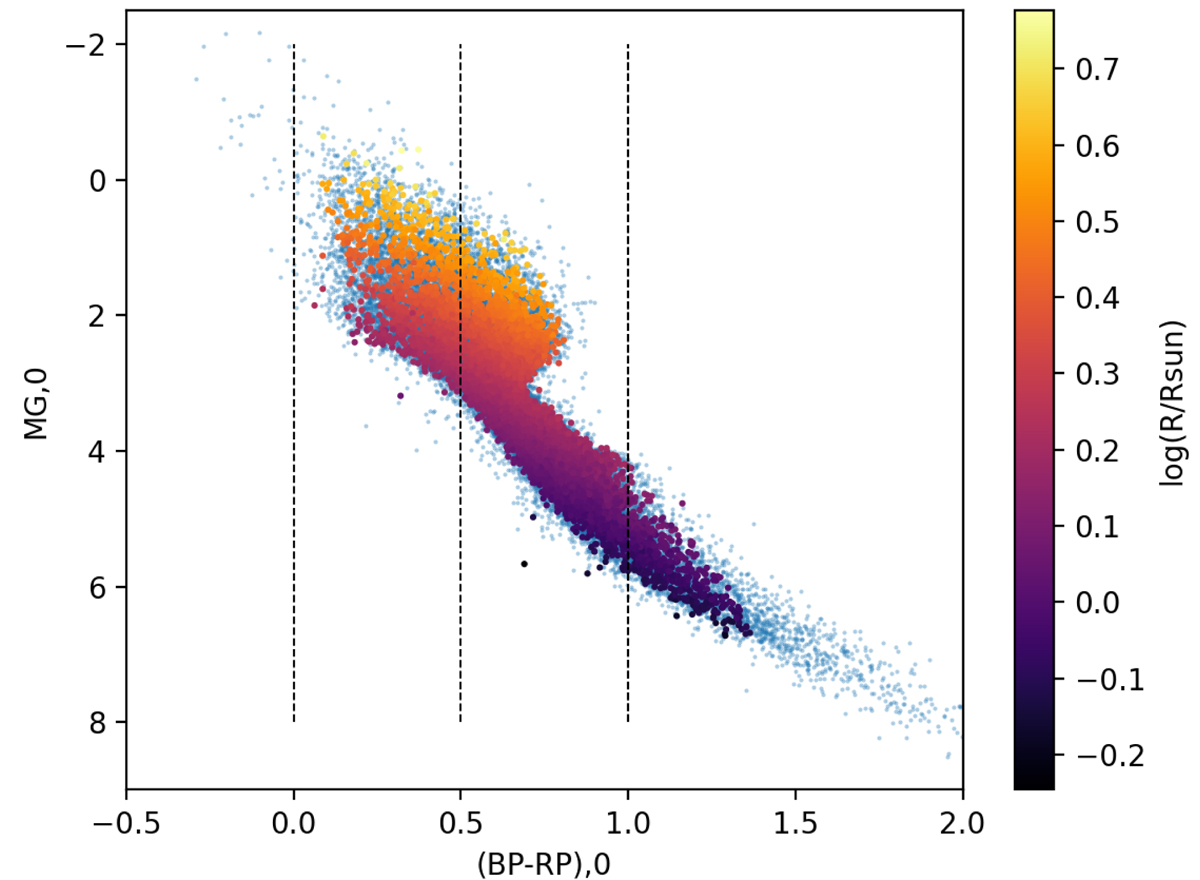
Fig. 19.
Download original image
Location in the dereddened HRD of the (GBP, 0 − GRP, 0) bins used in Fig. 20. Small blue dots correspond to the SB1s not selected by our selection criteria. The radius is the FLAME estimate.
Current usage metrics show cumulative count of Article Views (full-text article views including HTML views, PDF and ePub downloads, according to the available data) and Abstracts Views on Vision4Press platform.
Data correspond to usage on the plateform after 2015. The current usage metrics is available 48-96 hours after online publication and is updated daily on week days.
Initial download of the metrics may take a while.