Fig. 6
Download original image
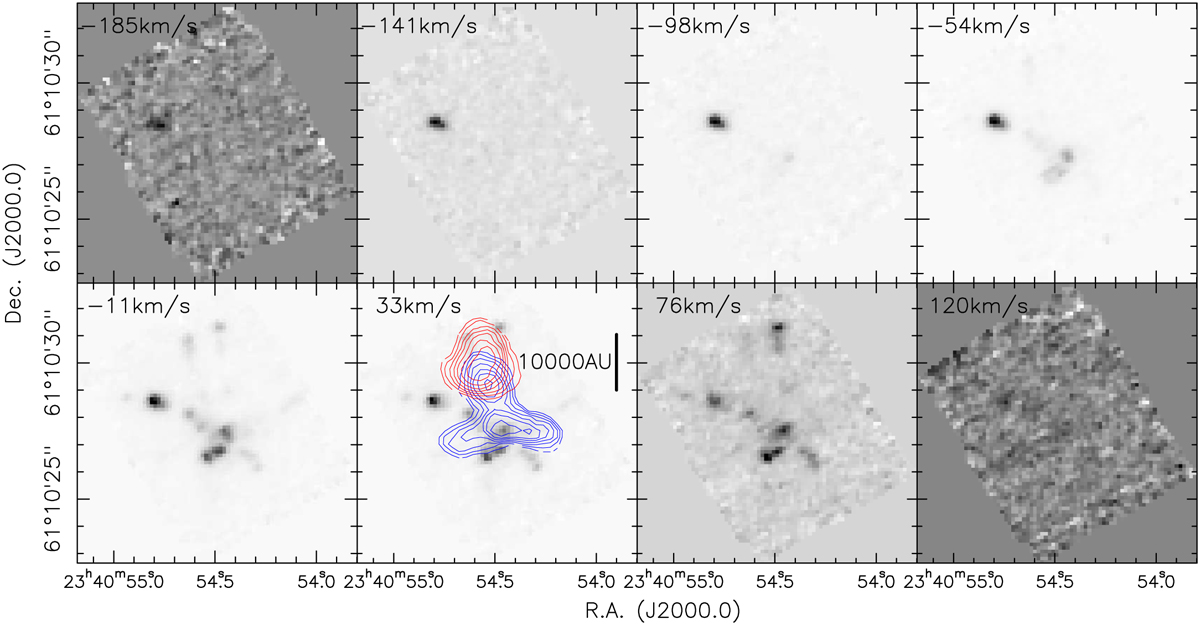
Channel map of the H2(0–0) S(7) line at 5.511 µm. The velocity of each channel is marked in units of km s−1 in the top-left corner of the panels. The red and blue contours in the 33 km s−1 channel correspond to the same redshifted and blueshifted SiO(2−1) emission as presented in Fig. 5. A linear scale-bar is shown in that panel as well. The υlsr is −50.2 km s−1.
Current usage metrics show cumulative count of Article Views (full-text article views including HTML views, PDF and ePub downloads, according to the available data) and Abstracts Views on Vision4Press platform.
Data correspond to usage on the plateform after 2015. The current usage metrics is available 48-96 hours after online publication and is updated daily on week days.
Initial download of the metrics may take a while.