Fig. 5
Download original image
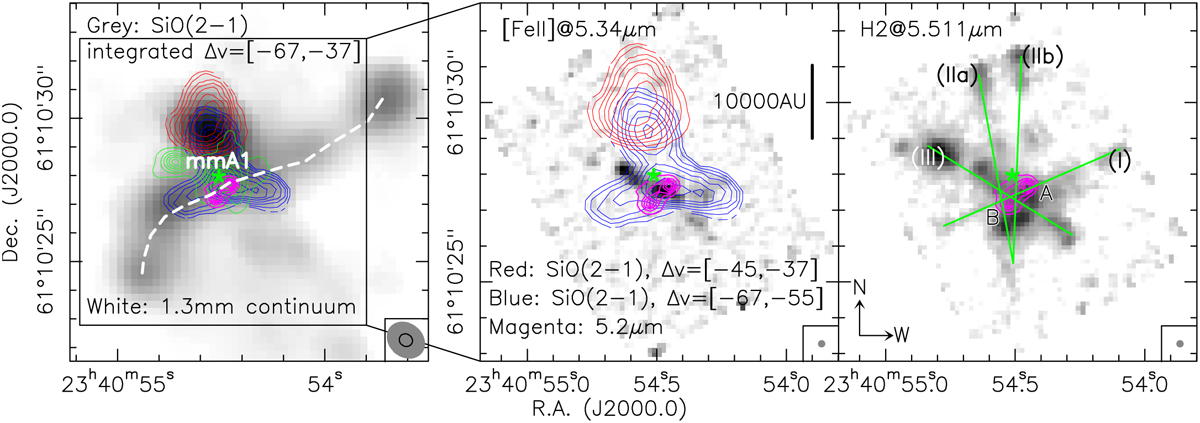
Outflow images in NOEMA SiO(2−1) (integrated emission, left panel), JWST [FeII](4F9/2−6D9/2) at 5.34 µm (middle panel), and JWST H2(0–0)S(7) at 5.511 µm (right panel). The red and blue contours show the redshifted and blueshifted NOEMA SiO(2−1) emission in the labeled velocity regimes (υlsr = −50.2 km s−1). Contour levels are from 30 to 90% (steps of 10%) of the respective integrated peak emission. The magenta contours show the 5.2 µm continuum emission (steps 20–90% by 15%). The green contours in the left panel outline the 1.3 mm continuum starting at the 20σ levels (1σ = 1.13 mJy beam−1). A linear scale-bar is presented in the middle panel, and the green lines in the right panel outline and label potential outflows. The two mid-infrared sources are labeled in the right panel as well. The dashed line in the left panel marks a potentially precessing outflow corresponding to outflow (I). A green star in all panels marks the main millimeter peak position labeled mmA1 in Cesaroni et al. (2019). North and west are labeled in the right panel. The resolution elements are shown at the bottom right of each panel. Left: SiO(2−1) in gray and the 1.3 mm continuum as a line. Middle: [FeII]. Right: H2.
Current usage metrics show cumulative count of Article Views (full-text article views including HTML views, PDF and ePub downloads, according to the available data) and Abstracts Views on Vision4Press platform.
Data correspond to usage on the plateform after 2015. The current usage metrics is available 48-96 hours after online publication and is updated daily on week days.
Initial download of the metrics may take a while.