Fig. 4
Download original image
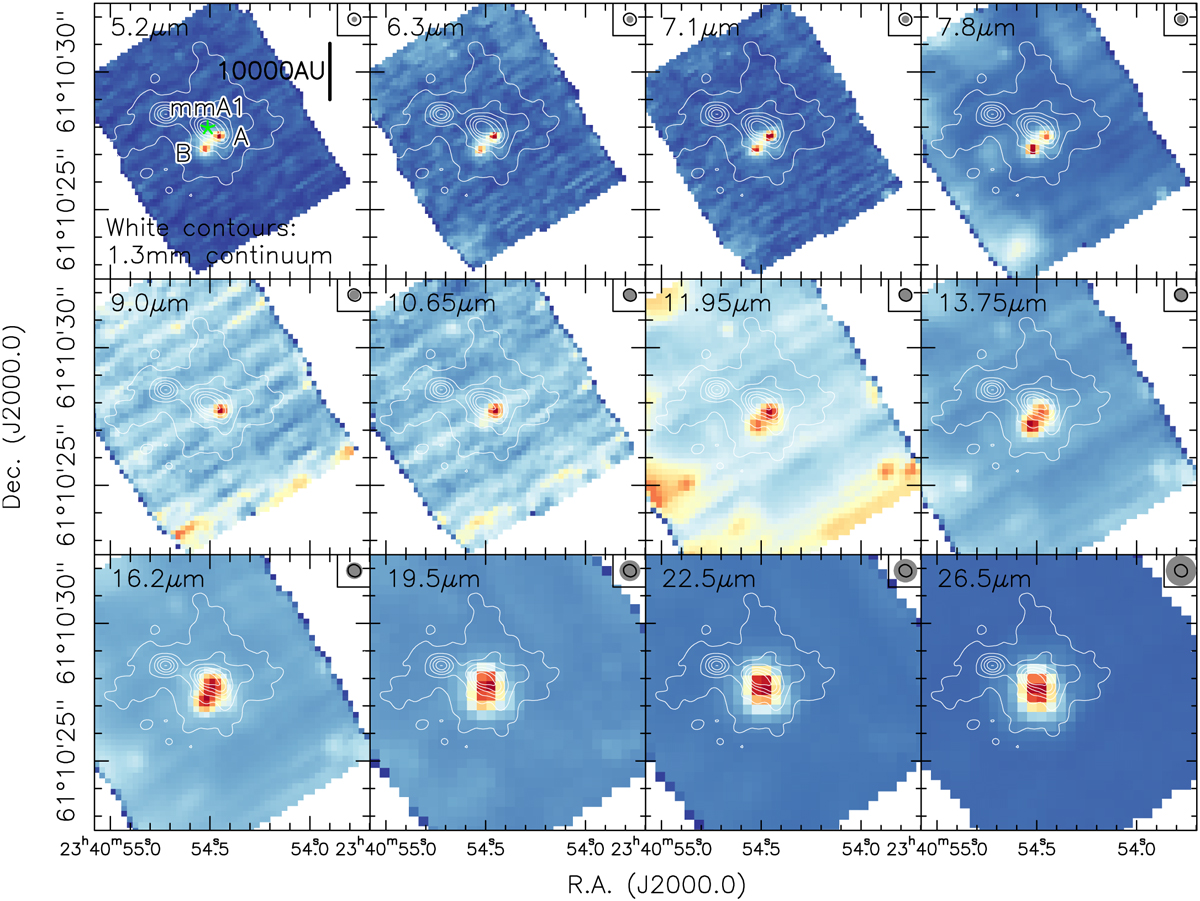
Continuum images of IRAS 23385+6053. The color scale presents the continuum emission extracted from the MIRI-IFU data cube in a line-free part of each spectral setting centered on the wavelength labeled in each panel. The contours outline the 1.3 mm emission (Beuther et al. 2018;Cesaroni et al. 2019) starting at the 5σ level of 0.55 mJy beam−1 and continuing in 25σ steps. In the top right of each panel, the corresponding spatial resolution is shown (gray: mid-infrared, line: 1.3 mm). In the top-left panel, the two main mid-infrared sources, A and B, are labeled, and the main millimeter peak from Cesaroni et al. (2019), mmA1, is marked with with a green star. A linear scale-bar is shown as well. Note that mid-infrared sources A and B are well separated up to 8 µm, but not at longer wavelengths.
Current usage metrics show cumulative count of Article Views (full-text article views including HTML views, PDF and ePub downloads, according to the available data) and Abstracts Views on Vision4Press platform.
Data correspond to usage on the plateform after 2015. The current usage metrics is available 48-96 hours after online publication and is updated daily on week days.
Initial download of the metrics may take a while.