Fig. 3
Download original image
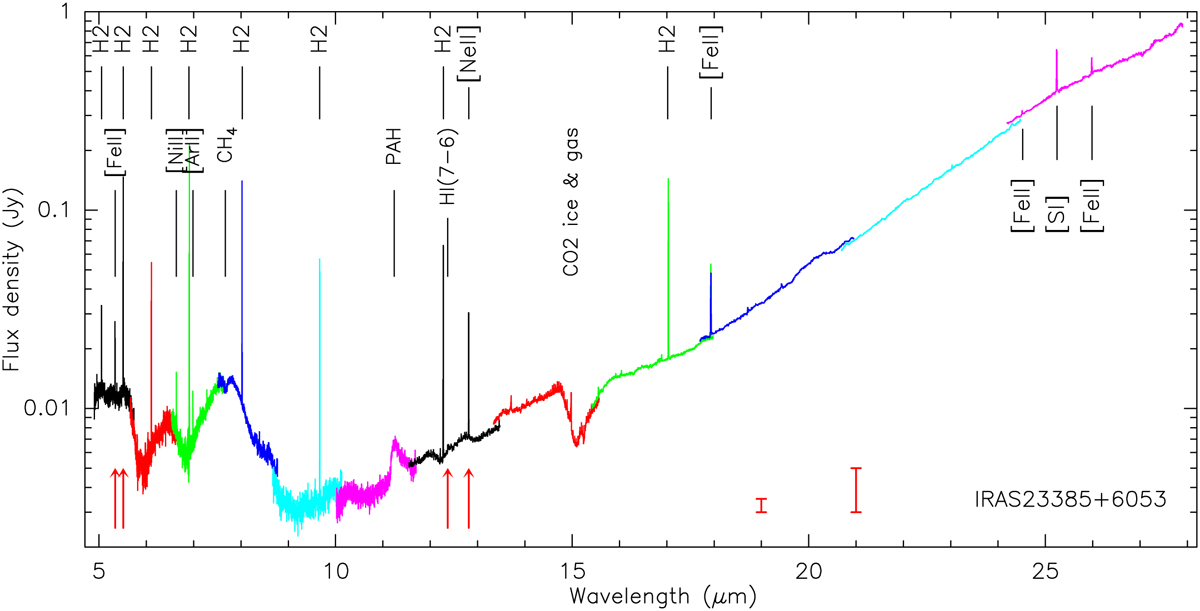
Full MIRI spectrum extracted toward the combined sources A and B (central position: RA (J2000.0) 23:40:54.49, Dec 61:10:27.4) within a diameter of 2.4″. The color coding separates the different sub-bands from channel 1 short to channel 4 long. Prominent strong atomic and molecular lines are labeled (see Table 1). The four main lines discussed in this paper are highlighted by the red arrows at the bottom. The data are not background-subtracted. The error bars at 19 and 21 µm show the approximate 1σ rms below and above 20 µm of ~0.5 and ~2 mJy (note the log-scale), respectively (Sect. 2).
Current usage metrics show cumulative count of Article Views (full-text article views including HTML views, PDF and ePub downloads, according to the available data) and Abstracts Views on Vision4Press platform.
Data correspond to usage on the plateform after 2015. The current usage metrics is available 48-96 hours after online publication and is updated daily on week days.
Initial download of the metrics may take a while.