Fig. 2
Download original image
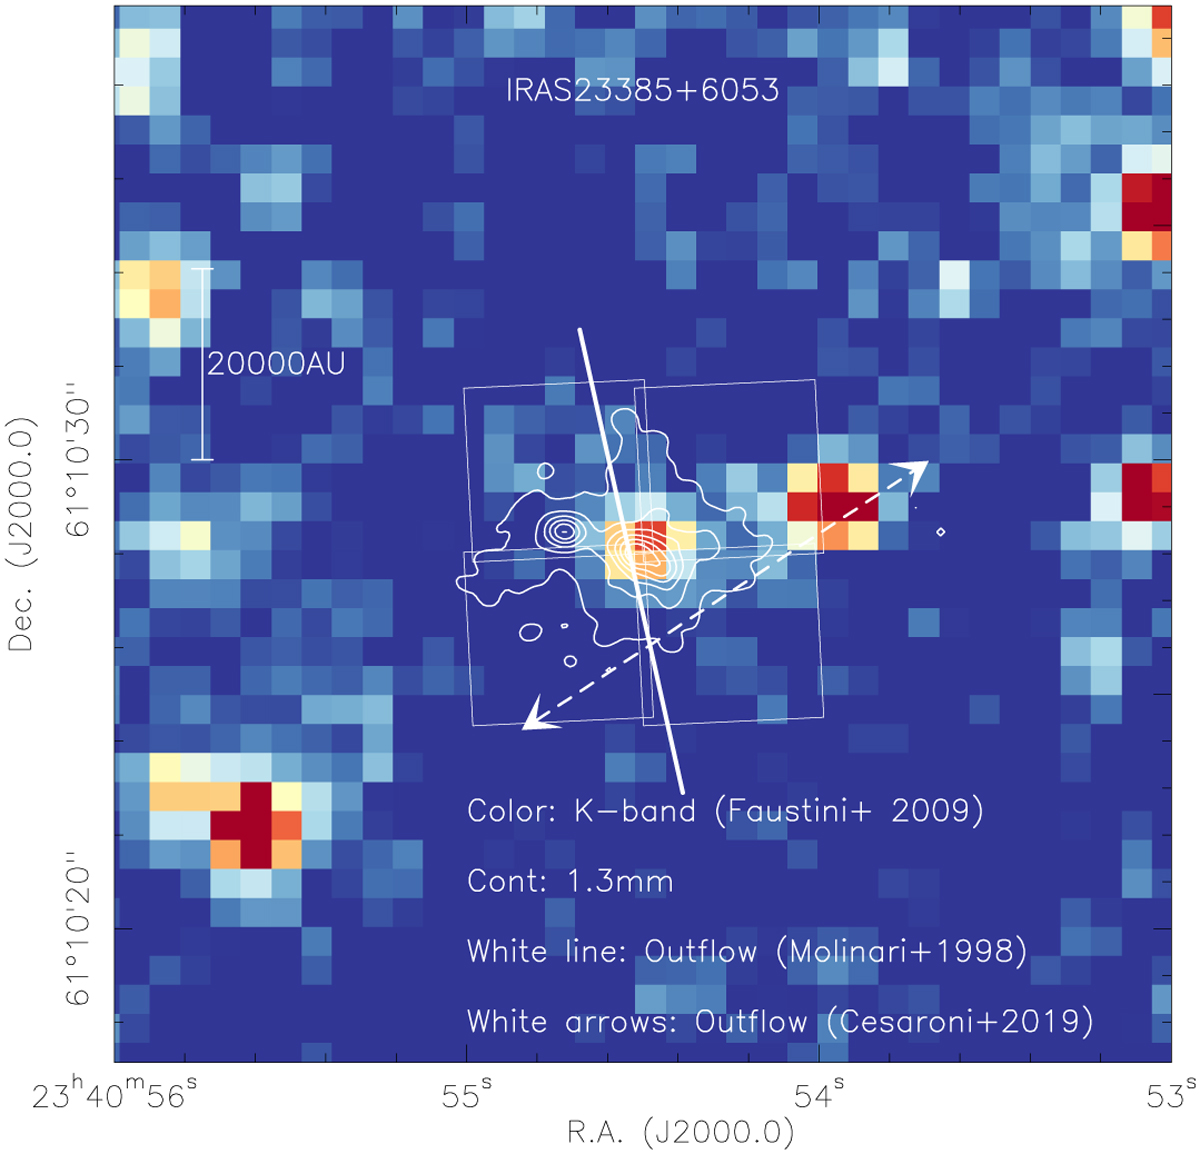
Infrared K-band data shown in color (taken with the Palomar 60-inch telescope and the NICMOS-3 array;Faustini et al. 2009). The contours outline the 1.3 mm emission (Beuther et al. 2018;Cesaroni et al. 2019). Contour levels start at 5σ (0.55 mJy beam−1) and continue in 25σ steps. The solid and dashed white lines show the directions of outflows identified in Molinari et al. (1998) and Cesaroni et al. (2019), respectively.
Current usage metrics show cumulative count of Article Views (full-text article views including HTML views, PDF and ePub downloads, according to the available data) and Abstracts Views on Vision4Press platform.
Data correspond to usage on the plateform after 2015. The current usage metrics is available 48-96 hours after online publication and is updated daily on week days.
Initial download of the metrics may take a while.