Fig. 1
Download original image
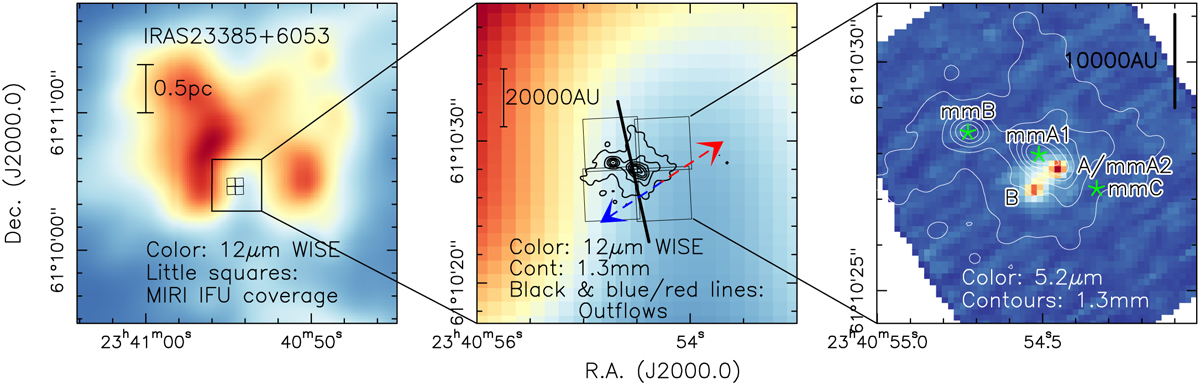
Overview of the region around IRAS 23385+6053. The left panel shows a large-scale overview, and the middle and right panels present zoomed-in views. The color scale in the left and middle panels shows the 12 µm emission from WISE at an angular resolution of 6.5″ (Wright et al. 2010). The little squares outline the field of view of the MIRI IFU mosaic in channel 1 (each square is 3.7″ × 3.7″). The color scale in the right panel shows the new MIRI 5.2 µm continuum emission (see also Fig. 4). The contours in the middle and right panels present the 1.3 mm continuum emission (Beuther et al. 2018;Cesaroni et al. 2019). The contours start at the 5σ level of 0.55 mJy beam−1 and continue in 25σ steps. The black lines and red and blue lines in the middle panel show the directions of outflows identified in Molinari et al. (1998) and Cesaroni et al. (2019), respectively. The right panel marks the mid-infrared sources A and Β as well as the millimeter sources labeled “mm” with the corresponding source letters from Cesaroni et al. (2019). Mid-infrared source A and millimeter source mm A2 are spatially colocated. A linear scale-bar is shown in all panels.
Current usage metrics show cumulative count of Article Views (full-text article views including HTML views, PDF and ePub downloads, according to the available data) and Abstracts Views on Vision4Press platform.
Data correspond to usage on the plateform after 2015. The current usage metrics is available 48-96 hours after online publication and is updated daily on week days.
Initial download of the metrics may take a while.