Fig. 4
Download original image
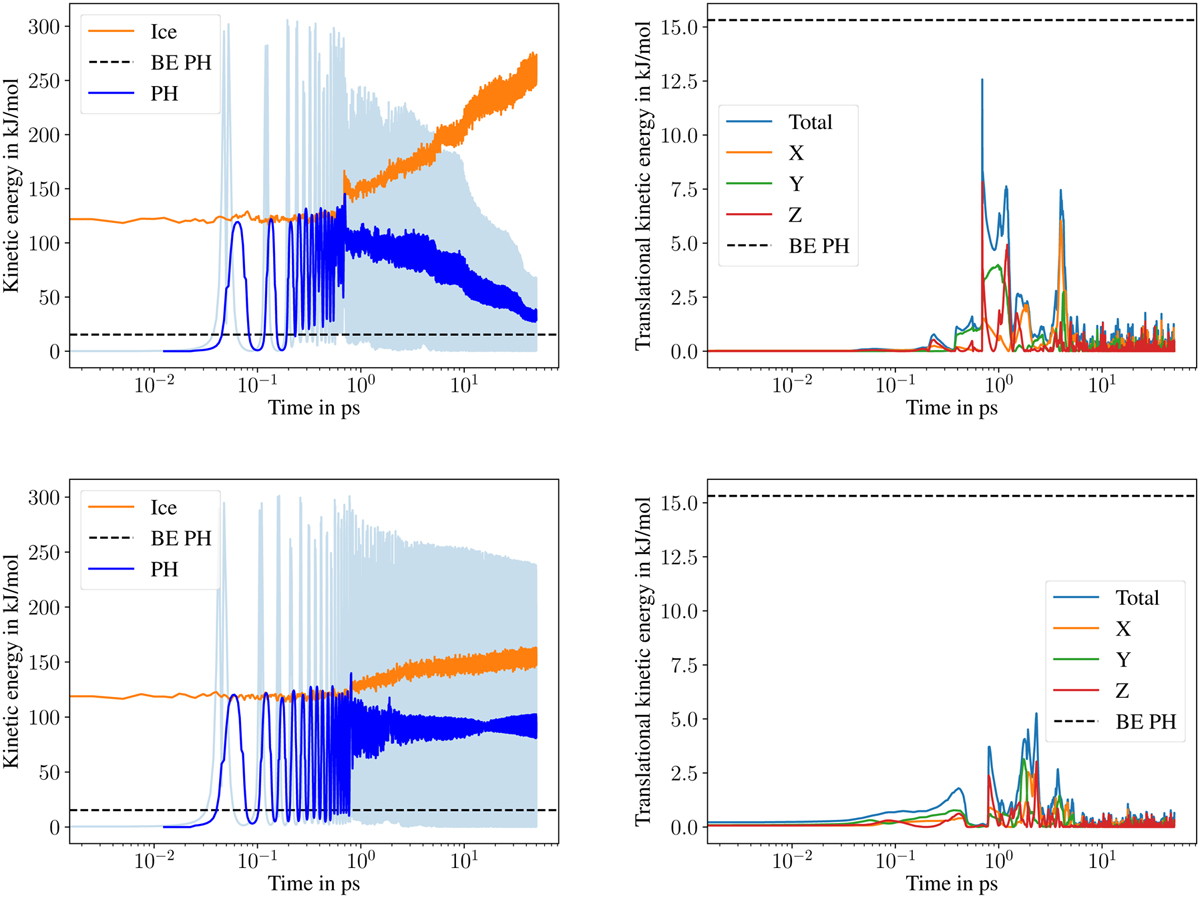
Evolution of total kinetic energy of water ice and PH molecules (left panels) and PH translational energy (right panels) for two P + H → PH reaction trajectories, one with significant energy dissipation in the time-lapse of the simulation (BE=739 K, top panel) and without significant energy dissipation (BE=805 K, bottom panel). The pale blue colour in the left panels shows the instantaneous kinetic energy of the PH molecule. The dark blue colour shows the running average evaluated over a window size of 25 fs. The black dashed line in both panels depicts the average PH binding energy. X, Y, and Z indicate the component along the translational energy is distributed, with Z being the normal to the surface.
Current usage metrics show cumulative count of Article Views (full-text article views including HTML views, PDF and ePub downloads, according to the available data) and Abstracts Views on Vision4Press platform.
Data correspond to usage on the plateform after 2015. The current usage metrics is available 48-96 hours after online publication and is updated daily on week days.
Initial download of the metrics may take a while.