Fig. 3.
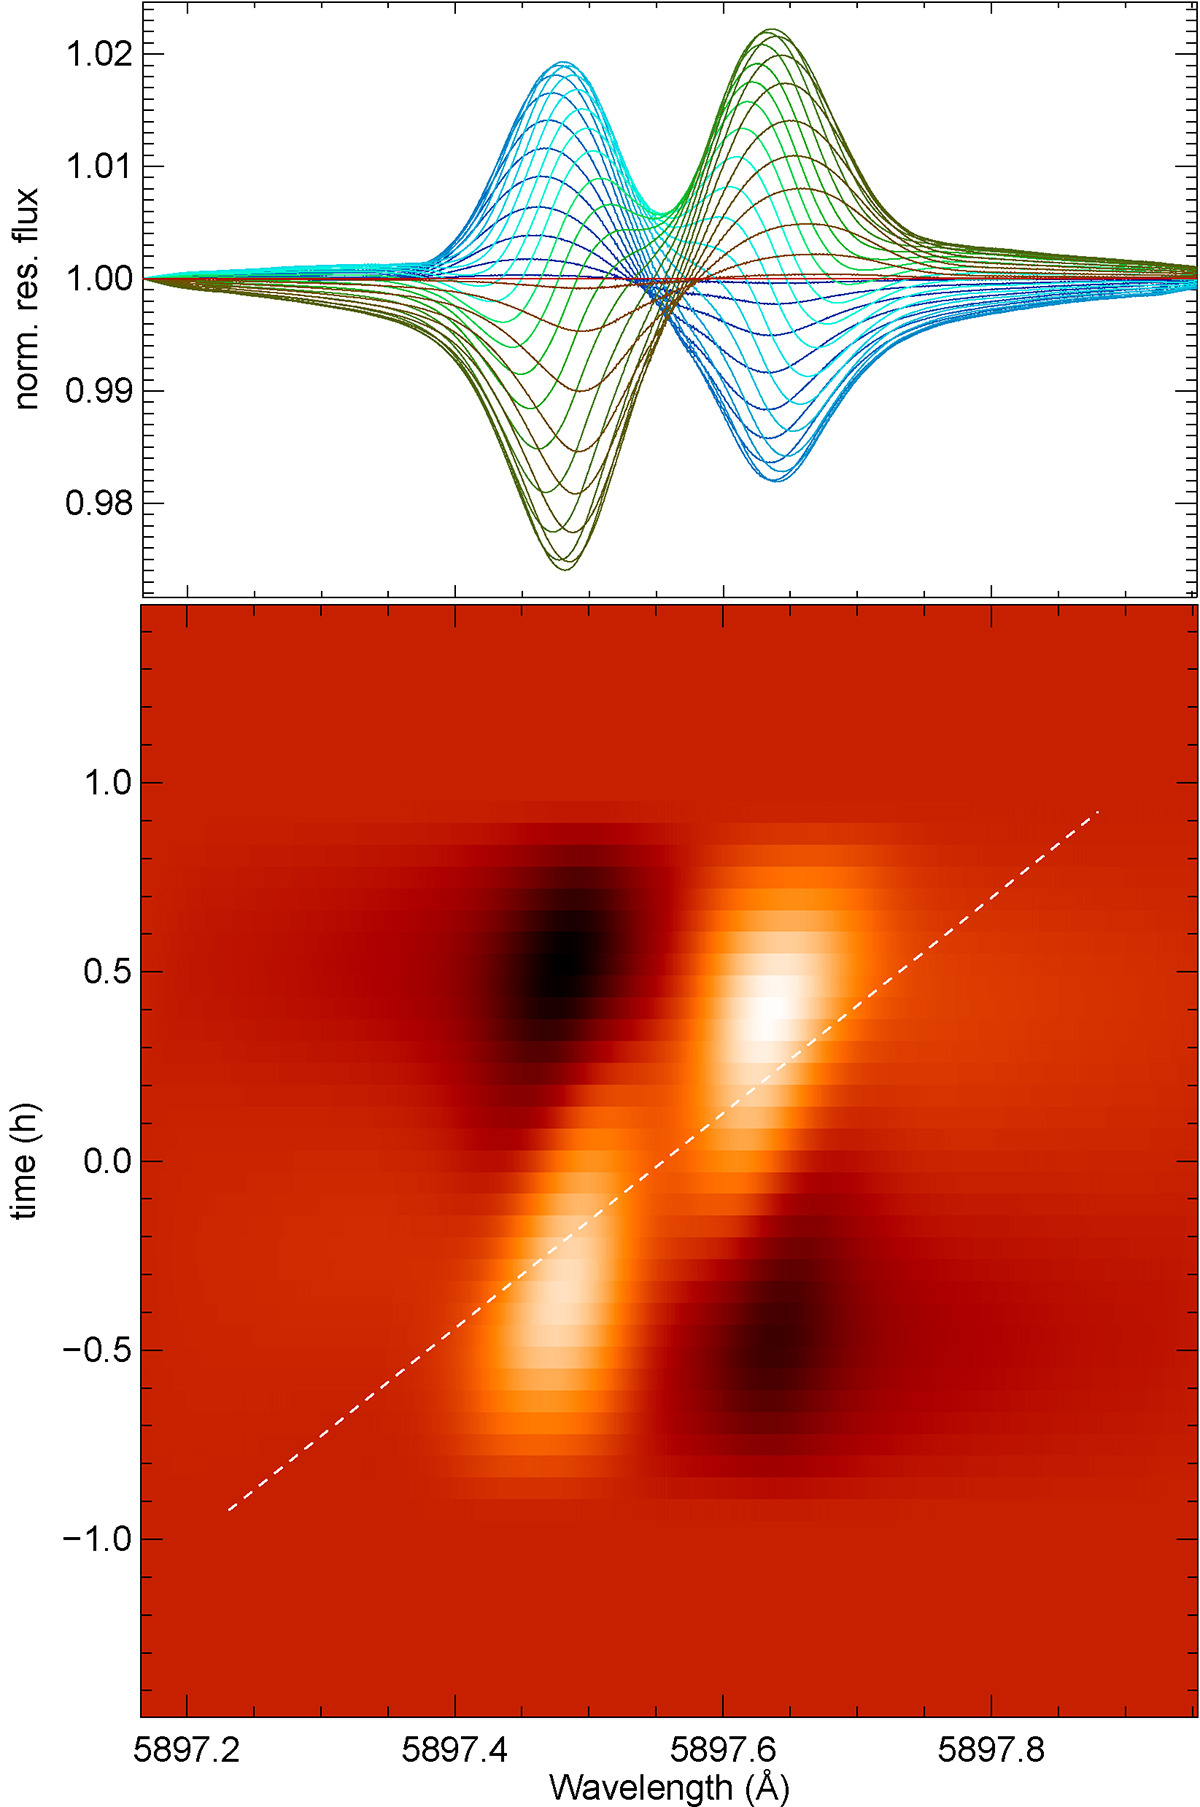
Download original image
Spectroscopic signature of the transiting planet in the Na I line. Top panel: residuals between spectra during the transit and out-of transit spectrum, with different colors indicating the time during transit. Lower panel: residuals shown as a dynamic spectrum with color indicating normalized residual flux, and a brighter color indicating larger values. The white dashed line shows the planetary path. The plot covers a velocity range of ±20 km s−1 around the line center.
Current usage metrics show cumulative count of Article Views (full-text article views including HTML views, PDF and ePub downloads, according to the available data) and Abstracts Views on Vision4Press platform.
Data correspond to usage on the plateform after 2015. The current usage metrics is available 48-96 hours after online publication and is updated daily on week days.
Initial download of the metrics may take a while.