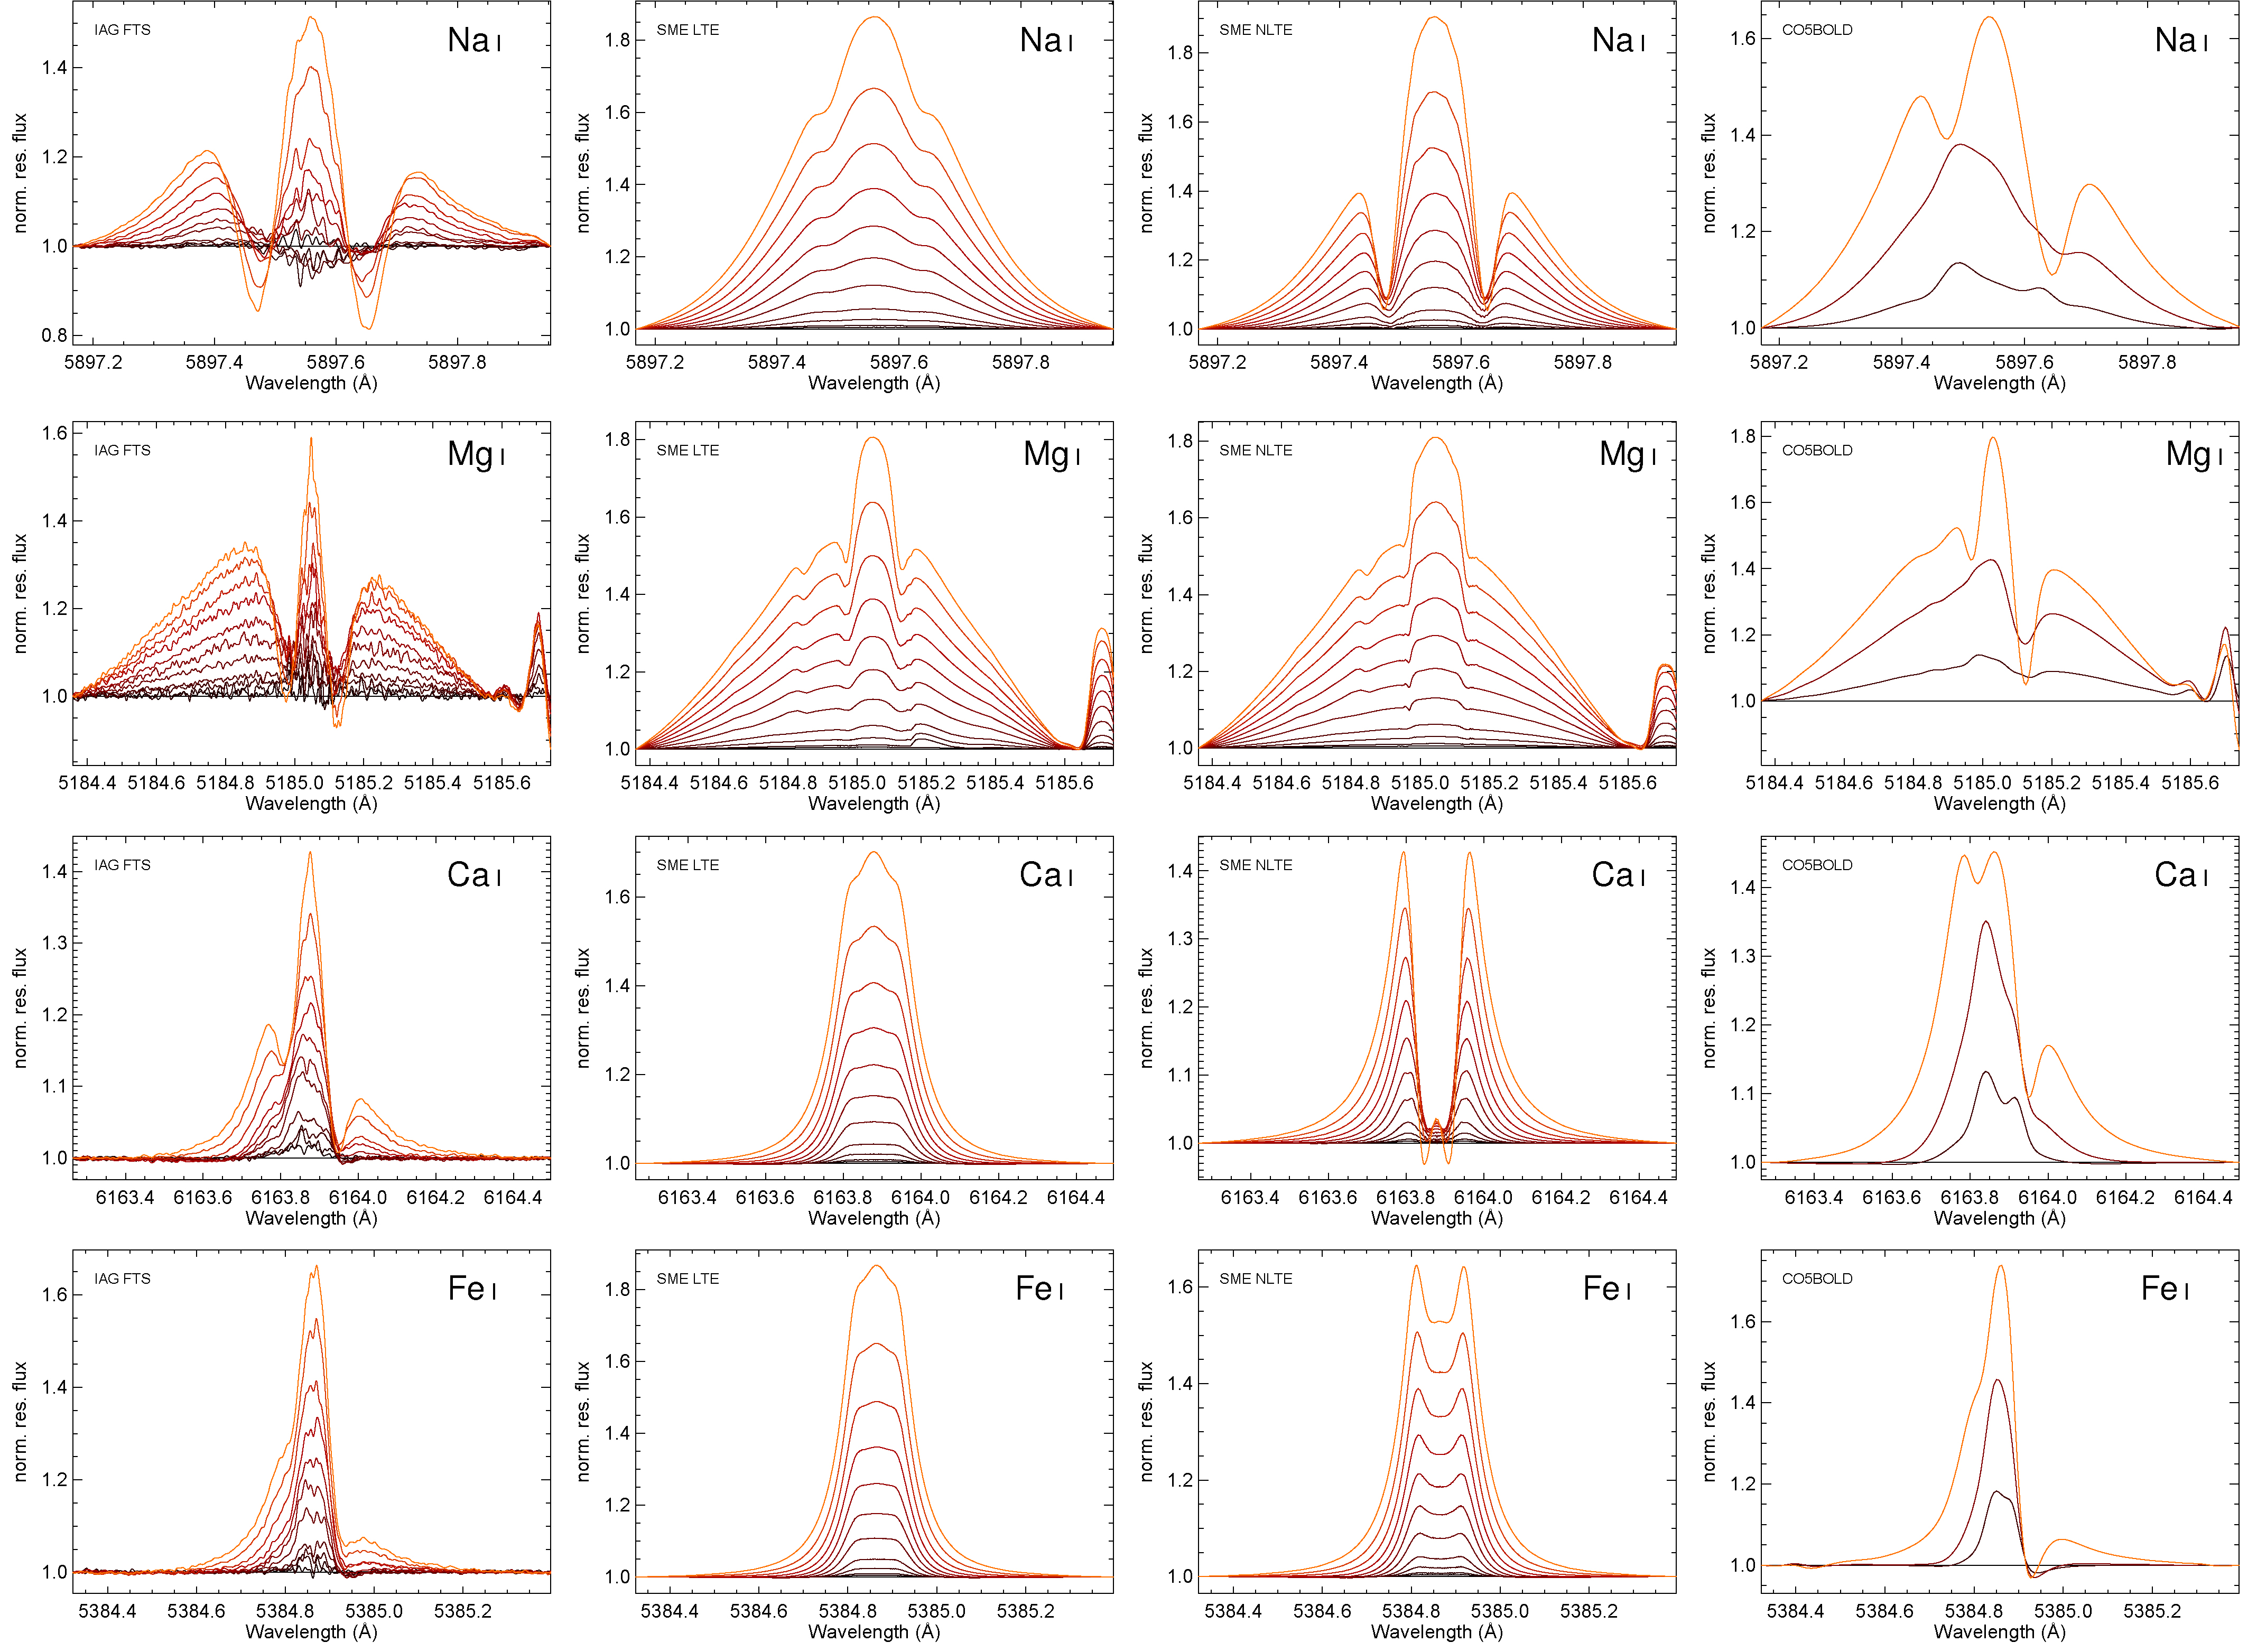
Fig. 2.
Download original image
Line ratios between spectra at different limb positions and the spectrum taken at disk center for four example lines: Na I 5897, Mg I 5185, Ca I 6163, and Fe I 5384 (from top to bottom, panels span velocity ranges ±20, ±40, ±30, and ±30 km s−1, respectively). The panels from left to right show observed IAG FTS spectra, and spectra for SME LTE, SME NLTE, and CO5BOLD calculations as dashed lines, respectively. For IAG FTS and SME spectra, limb positions μ = 1.0, 0.99, 0.98, 0.95, 0.9, 0.8, 0.7, 0.6, 0.5, 0.4, 0.3, 0.2 are shown. The CO5BOLD models are available for μ = 1.0, 0.79, 0.41, 0.09. A darker color is used for spectra taken closer to disk center.
Current usage metrics show cumulative count of Article Views (full-text article views including HTML views, PDF and ePub downloads, according to the available data) and Abstracts Views on Vision4Press platform.
Data correspond to usage on the plateform after 2015. The current usage metrics is available 48-96 hours after online publication and is updated daily on week days.
Initial download of the metrics may take a while.