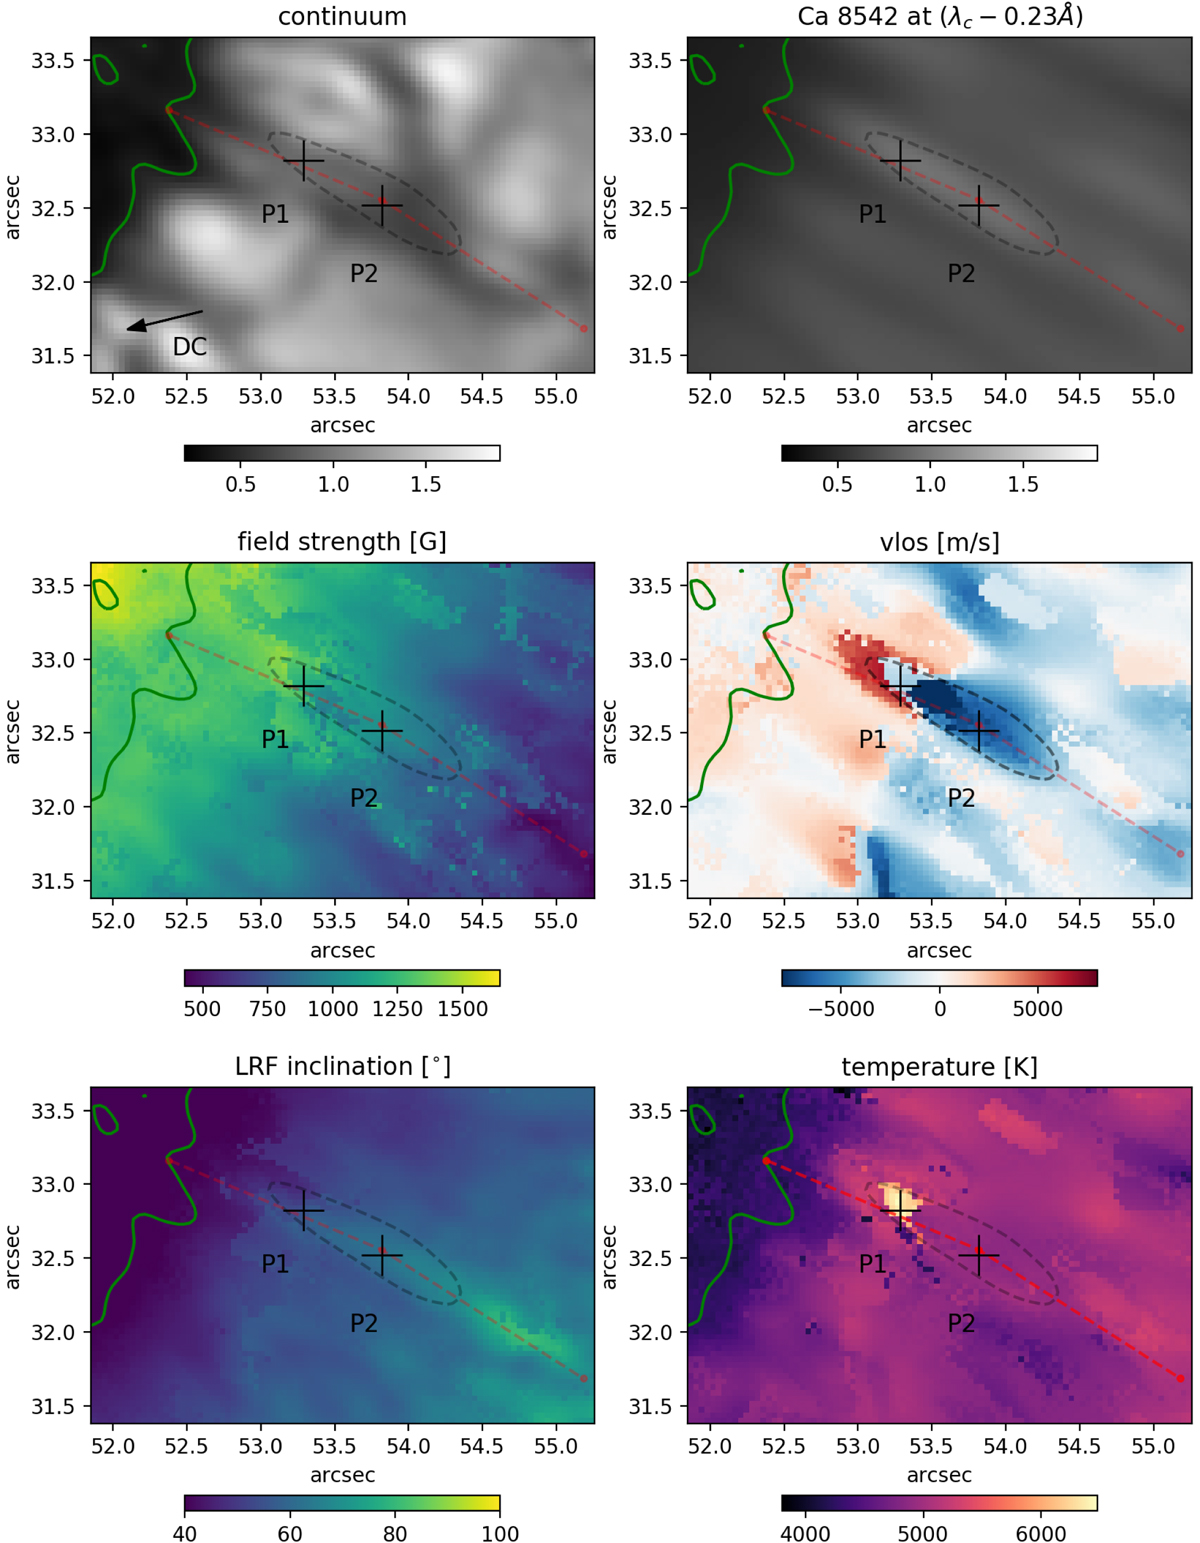
Fig. 9.
Download original image
Intensity images and STiC atmospheric parameters at log τ = −3.5 from the time step at 02 min 55 s. Gray-dashed line represents a contour in the blue-wing slope maps (see Fig. 7) at the level of zero. The green contour outlines the pore boundary in continuum intensity. The value range of the inclination map was set to [40,100] to allow for direct comparisons to other maps. The black arrow in the bottom-left corner of the continuum maps points toward disk center. The green contour outlining the pore was produced from the CHROMIS image at the continuum wavelength point at 4000 Å and is overplotted on the other panels.
Current usage metrics show cumulative count of Article Views (full-text article views including HTML views, PDF and ePub downloads, according to the available data) and Abstracts Views on Vision4Press platform.
Data correspond to usage on the plateform after 2015. The current usage metrics is available 48-96 hours after online publication and is updated daily on week days.
Initial download of the metrics may take a while.