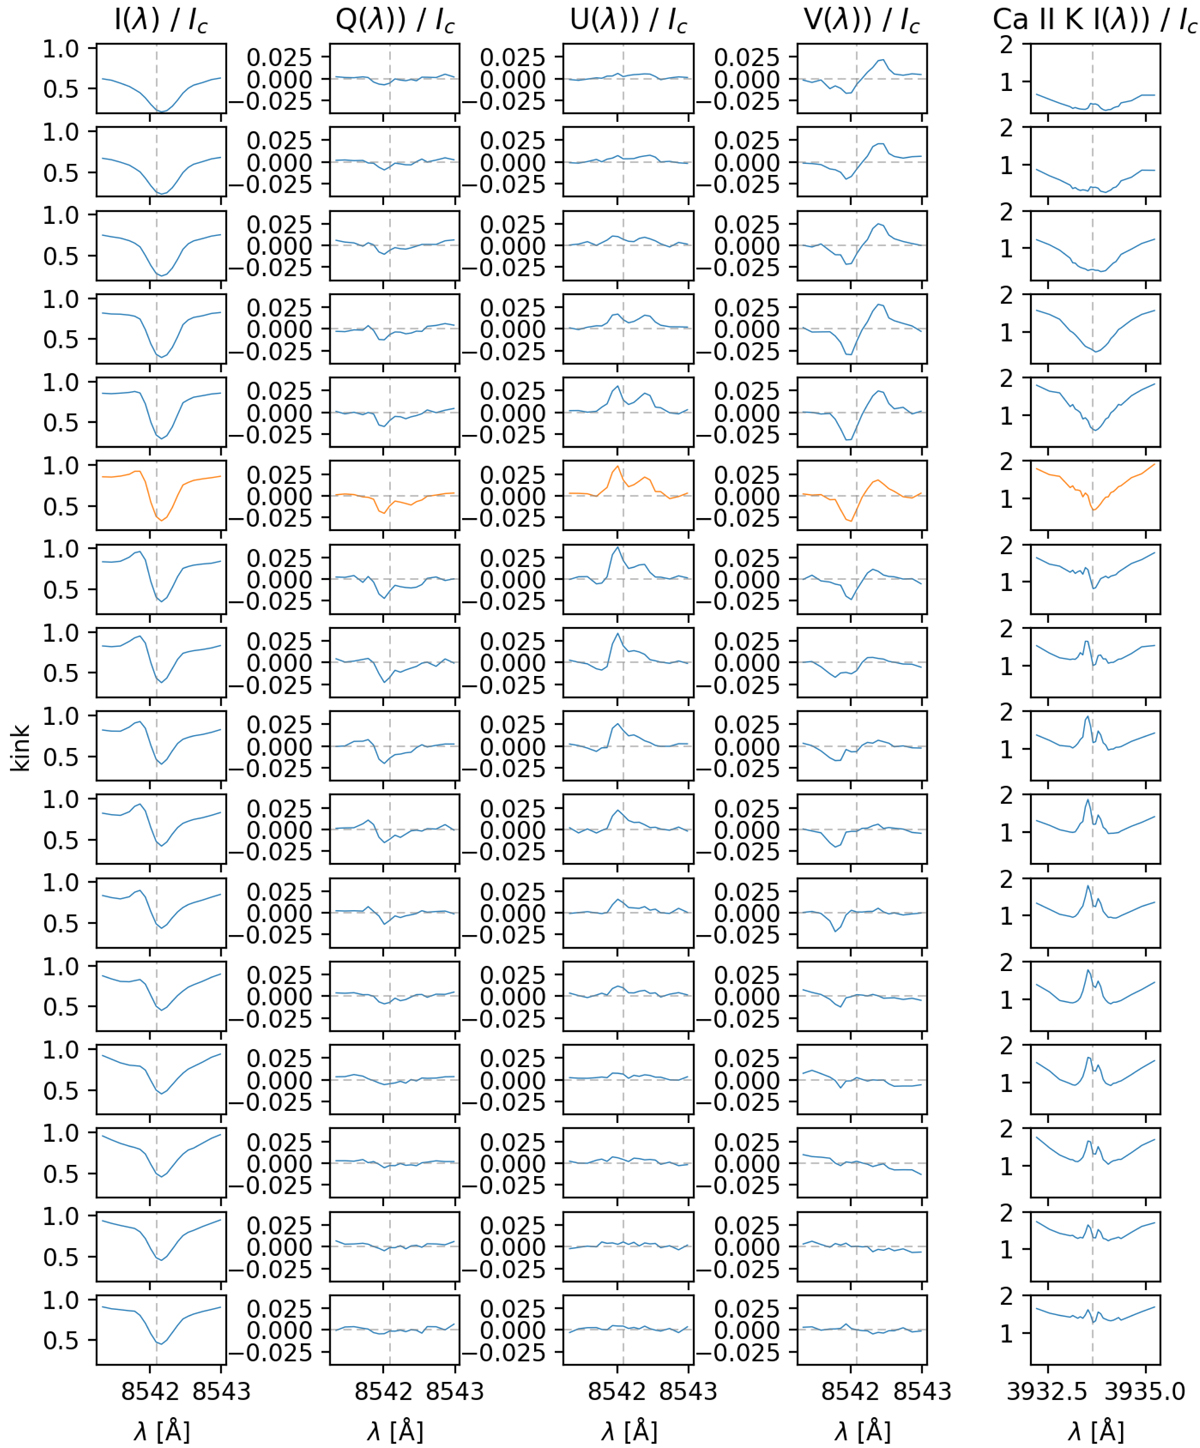
Fig. 6.
Download original image
Column one to column four: Stokes-I, Stokes-Q, Stokes-U, and Stokes-V of the Ca II 8542 Å line. Column five (on the right): Stokes-I of the Ca II K 3934 Å. Rows from top to bottom show spectra of pixels along the red-dashed line shown in Fig. 3. Every fifth pixel is shown here. The dashed vertical line depicts the laboratory wavelength of the line center. The spectra of the pixel at the kink of the red-dashed line are shown in row 9 (labeled with the word “kink” on the left side of the plot). All spectra are from the time step at tobs = 02 min 55 s.
Current usage metrics show cumulative count of Article Views (full-text article views including HTML views, PDF and ePub downloads, according to the available data) and Abstracts Views on Vision4Press platform.
Data correspond to usage on the plateform after 2015. The current usage metrics is available 48-96 hours after online publication and is updated daily on week days.
Initial download of the metrics may take a while.