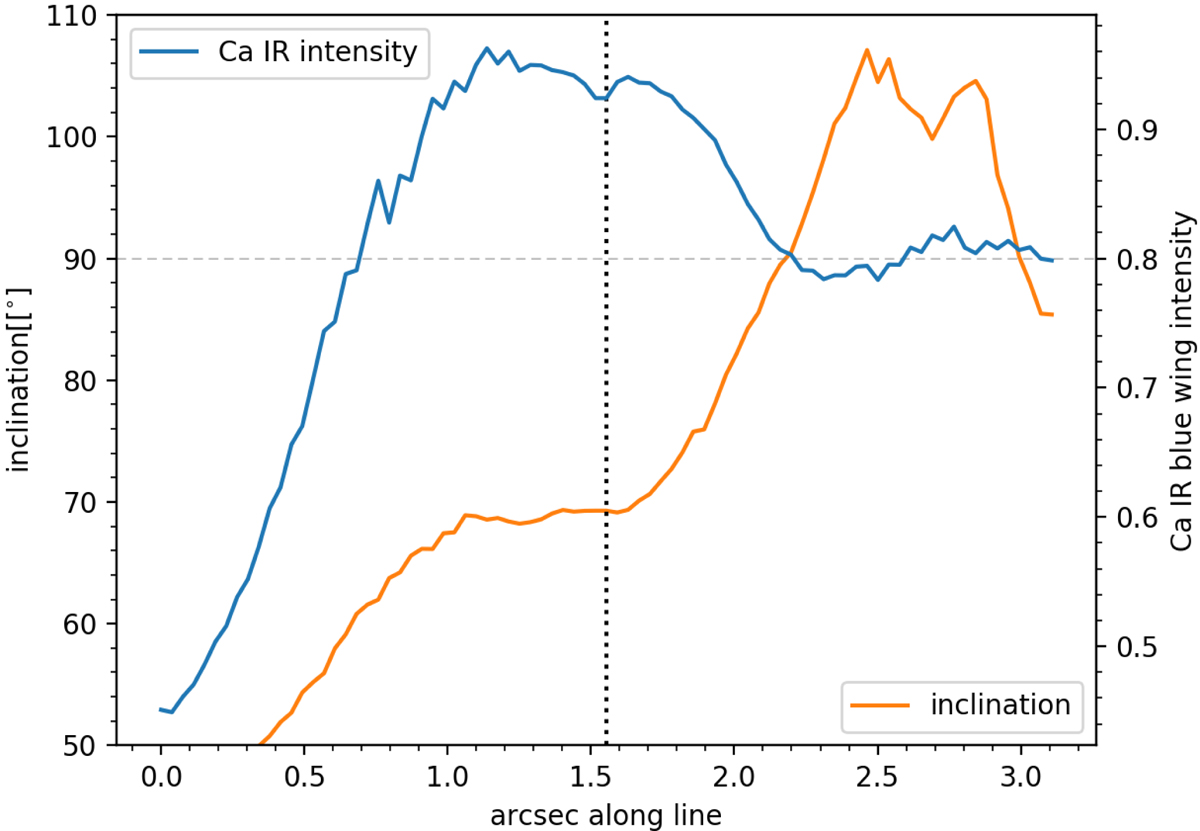
Fig. 4.
Download original image
LRF inclination (orange line) and Ca II 8542 Å blue-wing intensity (blue line, second axis on the right) along the red-dashed line plotted in Fig. 3. The value range of the inclination axis is cropped at 50° for better visibility of the distribution. The Ca II 8542 Å intensities were normalized to a an average over the full FOV of a quasi continuum wavelength point. Time: tobs = 02 min 55 s.
Current usage metrics show cumulative count of Article Views (full-text article views including HTML views, PDF and ePub downloads, according to the available data) and Abstracts Views on Vision4Press platform.
Data correspond to usage on the plateform after 2015. The current usage metrics is available 48-96 hours after online publication and is updated daily on week days.
Initial download of the metrics may take a while.