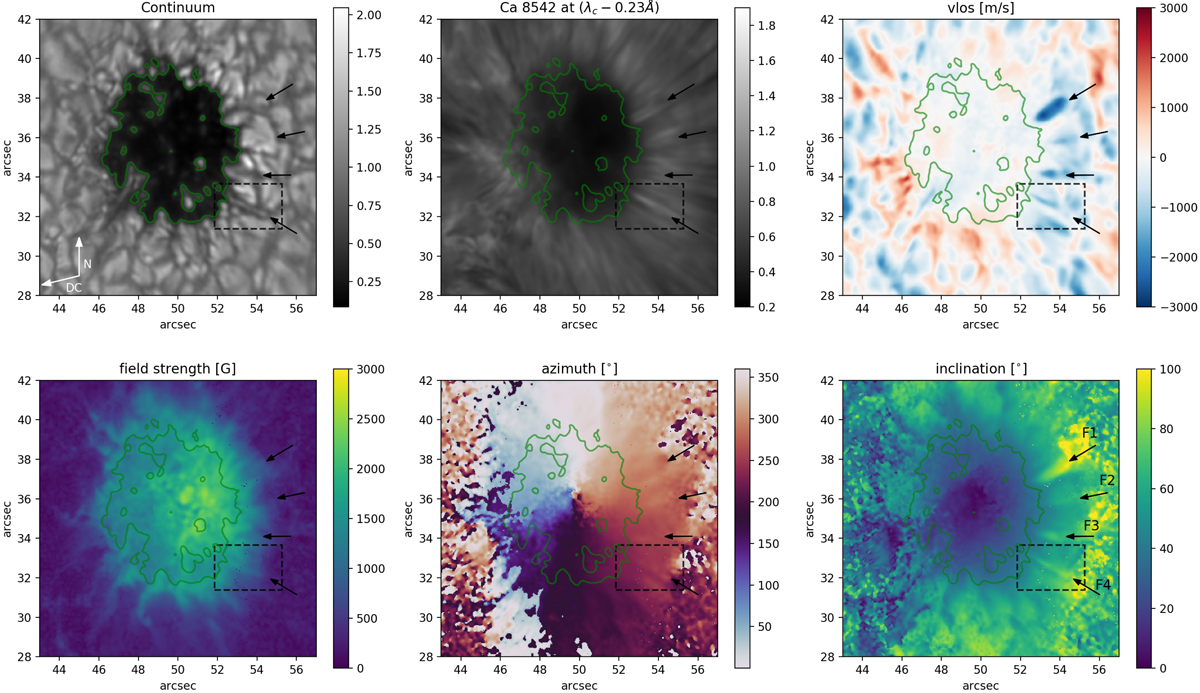
Fig. 2.
Download original image
Maps showing continuum (from the CHROMIS instrument at 4000 Å) on the top left, the blue-wing intensity from the Ca II 8542 Å line (from the CRISP instrument) at the center-top, and the VFISV inversion results LOS velocity (top right), magnetic field strength (bottom-left), LRF azimuth angle (bottom-center), and LRF inclination angle of the magnetic field (bottom right). The value range of the inclination map has been clipped for better visibility. Time step: tobs = 0 s. The green contour outlining the pore was produced from the CHROMIS image at the continuum wavelength point at 4000 Å and is overplotted on the other panels.
Current usage metrics show cumulative count of Article Views (full-text article views including HTML views, PDF and ePub downloads, according to the available data) and Abstracts Views on Vision4Press platform.
Data correspond to usage on the plateform after 2015. The current usage metrics is available 48-96 hours after online publication and is updated daily on week days.
Initial download of the metrics may take a while.