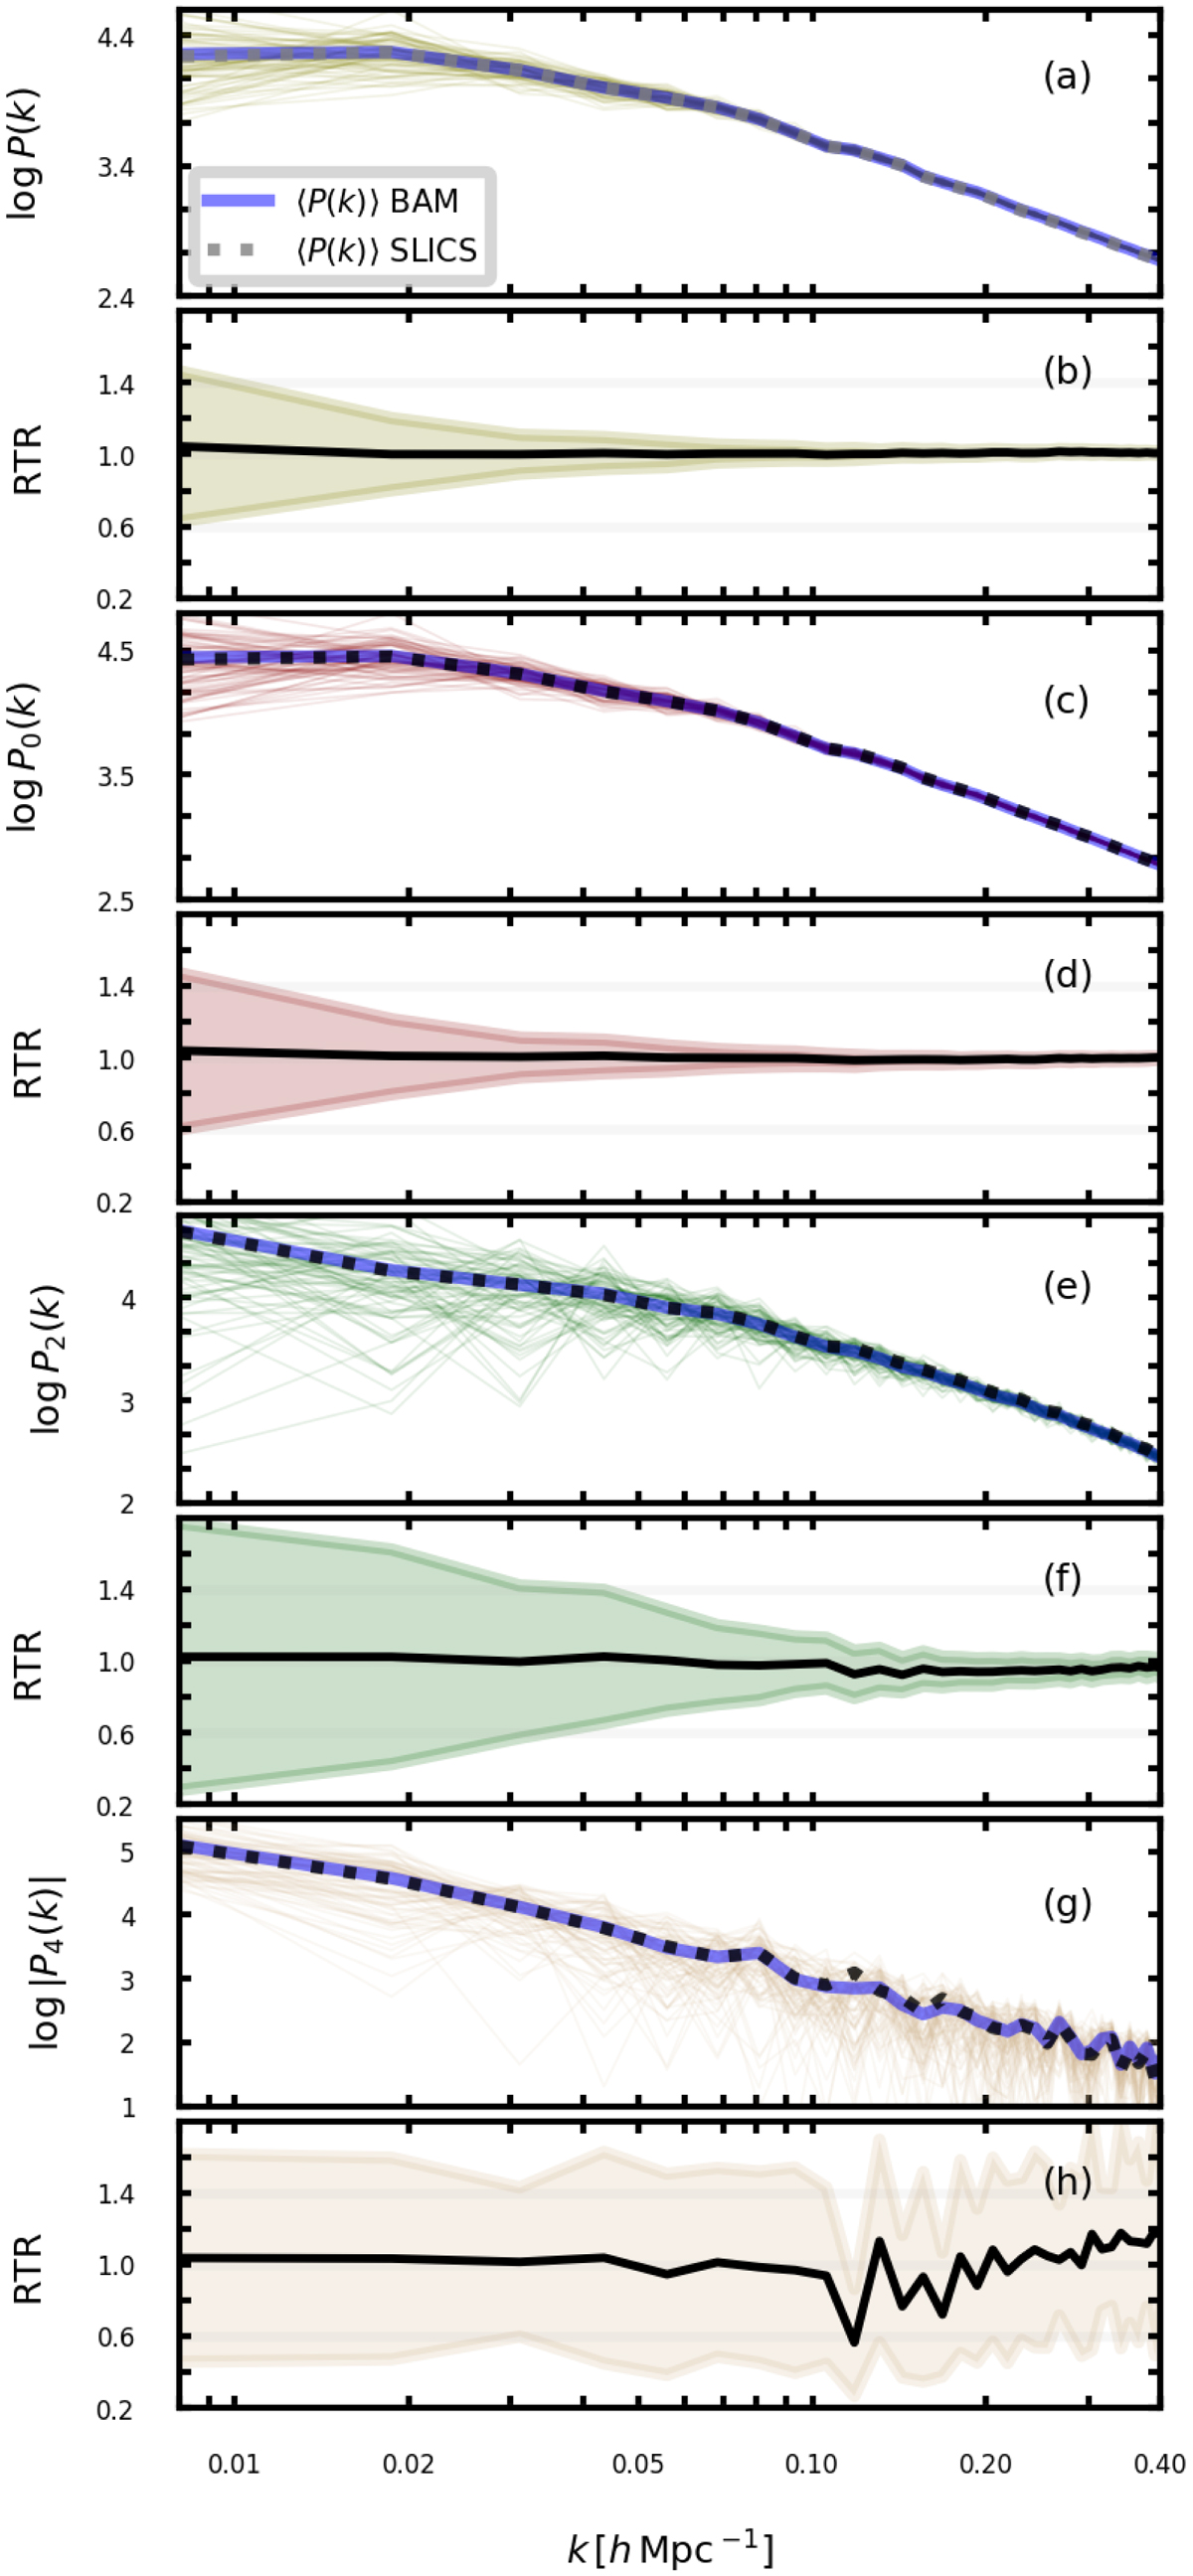
Fig. 9.
Download original image
Power spectrum of halo catalogues in real space P(k), (panels (a) and (b)) and redshift space, with the latter represented by the monopole P0(k), (panels (c) and (d)), the quadrupole P2(k), (panels (e) and (f)), and the hexadecapole P4(k), (panels (g) and (h)). Panels (a), (c), (e), and (g) show the mean power spectrum from the 80 SLICS realisations (grey dashed line) and the mean from the same number of BAM mocks (solid blue lines). Panels (b), (d), and (f) show the ratio (RTR) of the BAM mean spectrum to that of the reference. The shaded areas denote the standard deviation computed from the mean and variance of each set.
Current usage metrics show cumulative count of Article Views (full-text article views including HTML views, PDF and ePub downloads, according to the available data) and Abstracts Views on Vision4Press platform.
Data correspond to usage on the plateform after 2015. The current usage metrics is available 48-96 hours after online publication and is updated daily on week days.
Initial download of the metrics may take a while.