Fig. 7.
Download original image
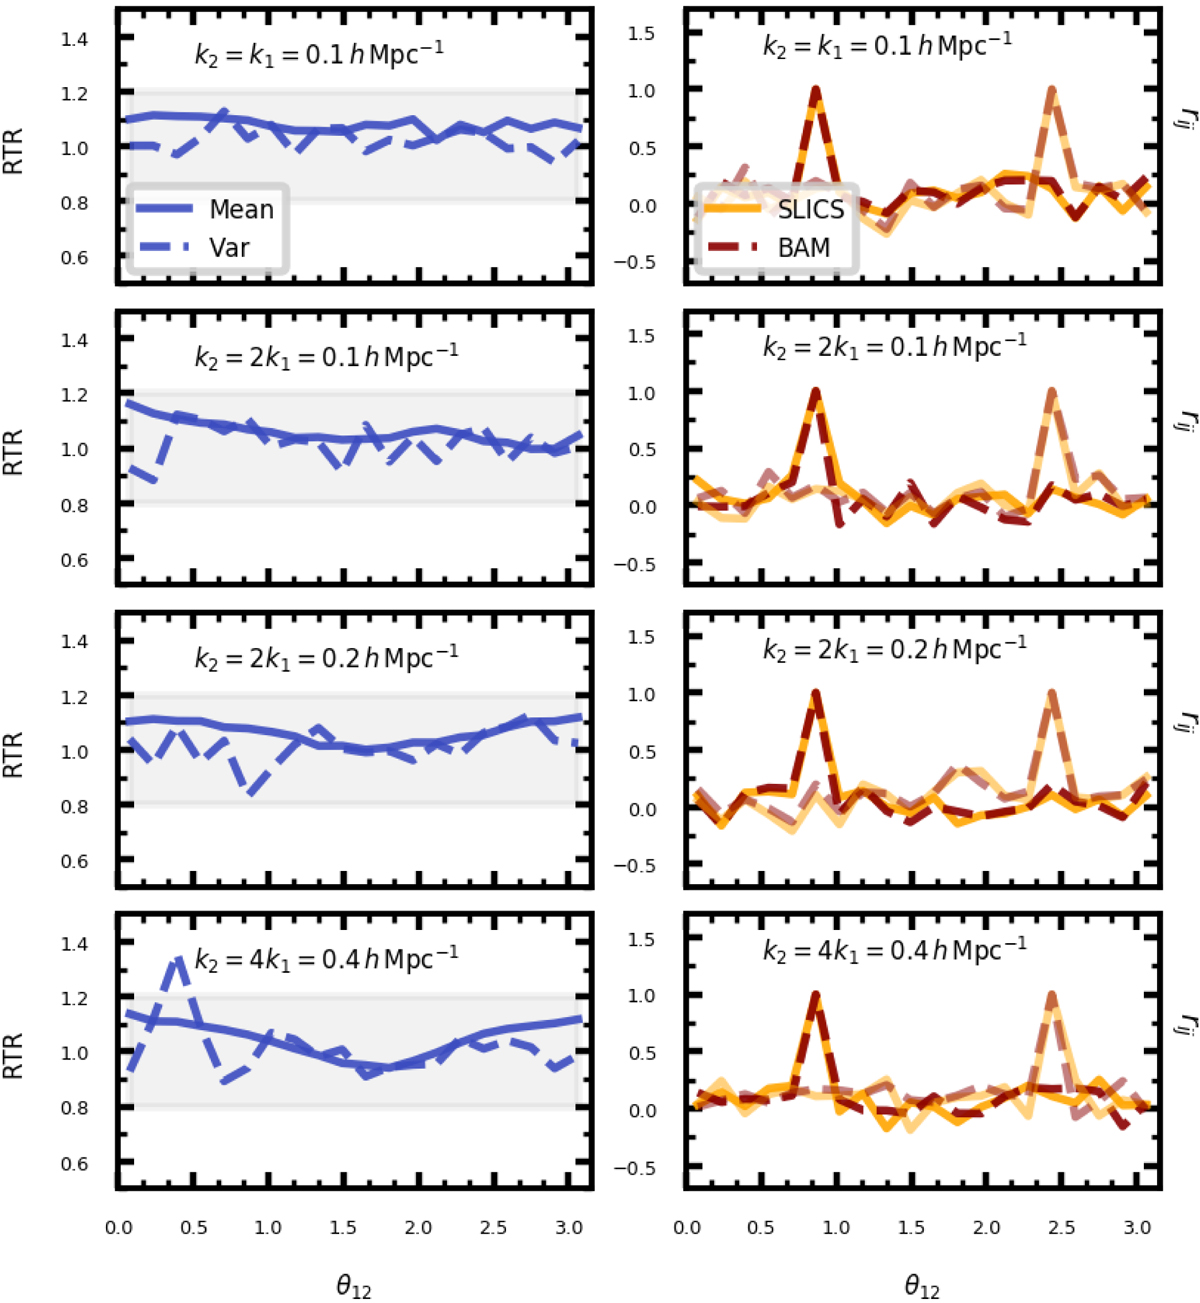
Comparison of the signal of reduced bispectrum obtained from 80 mock catalogues generated with BAM (using the TkWEB model) and the same signal from the reference set, for several triangle configurations, which are specified in each panel. The left column shows the ratio to the reference (RTF) of the mean (solid lines) and variance (dashed lines); the shaded areas in the panels of this column denote a 20% deviation from unity. The right column shows two elements of the correlation coefficients of the bispectrum rij.
Current usage metrics show cumulative count of Article Views (full-text article views including HTML views, PDF and ePub downloads, according to the available data) and Abstracts Views on Vision4Press platform.
Data correspond to usage on the plateform after 2015. The current usage metrics is available 48-96 hours after online publication and is updated daily on week days.
Initial download of the metrics may take a while.