Fig. 4.
Download original image
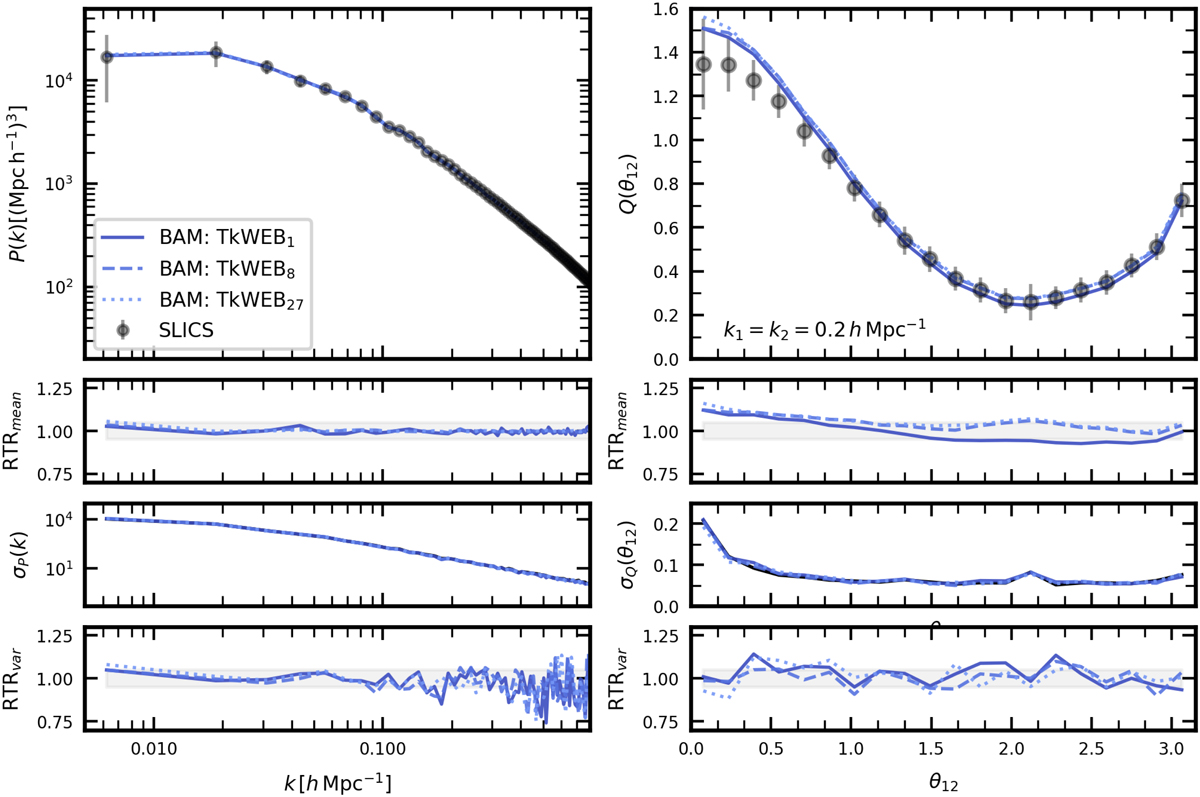
Power spectrum (left) and reduced bispectrum (right, isosceles configurations) computed from sets of mock halo number-count catalogues (of 80 realisations each) obtained from the calibration of BAM using the TkWEB model as described in Sect. 2.6. The first row shows the mean in each summary statistic. The second row shows the ratio of the mean statistics to that from the reference (RTRmean). The third row shows the variance in the respective statistics, and the fourth their respective ratio to the variance from the reference ensemble (RTRvar). The shaded area in the second row denotes the 5% deviation to unity.
Current usage metrics show cumulative count of Article Views (full-text article views including HTML views, PDF and ePub downloads, according to the available data) and Abstracts Views on Vision4Press platform.
Data correspond to usage on the plateform after 2015. The current usage metrics is available 48-96 hours after online publication and is updated daily on week days.
Initial download of the metrics may take a while.