Fig. 3.
Download original image
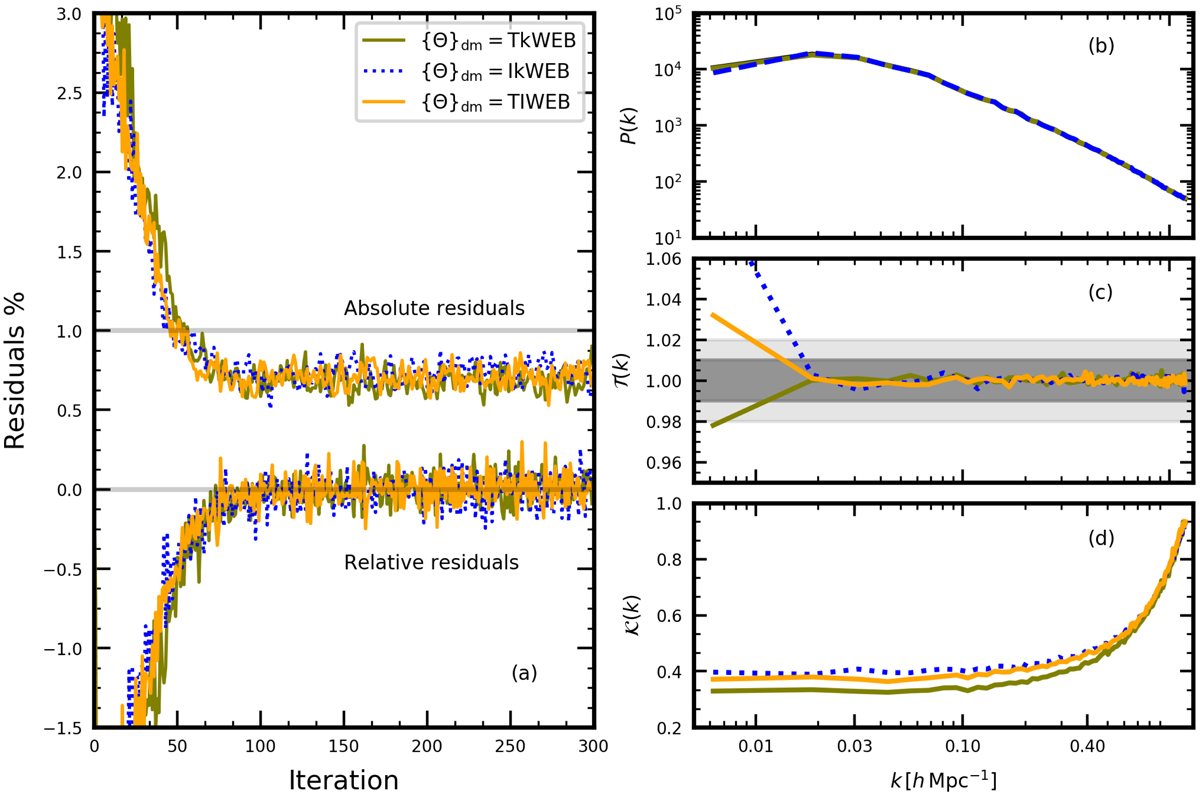
Summary statistics of the calibration procedure in BAM based on one SLICS realisation. Panel (a): Residuals computed from the reference power spectrum and the halo power spectrum at different iterations within the calibration procedure. Absolute residuals (see Eq. (13)) show that the calibration leads to a precise (< 1%) reconstruction of the halo number counts and its two-point statistics, while relative values show that the deviation around the reference is randomly distributed, with a ∼0.15% amplitude. The different lines in each case show the behaviour under different models (TkWEB, IkWEB, TIWEB) of halo bias (see Sect. 2.6 for details). Panel (b) shows the power spectrum from the reconstructed halo number counts field in each of the halo models. Panel (c) shows the transfer function 𝒯i(k) computed as in Eq. (11), evaluated at the last iteration of the calibration procedure; the shaded area denotes the 3% deviation around unity. Panel (d) shows the BAM kernel computed using Eq. (12).
Current usage metrics show cumulative count of Article Views (full-text article views including HTML views, PDF and ePub downloads, according to the available data) and Abstracts Views on Vision4Press platform.
Data correspond to usage on the plateform after 2015. The current usage metrics is available 48-96 hours after online publication and is updated daily on week days.
Initial download of the metrics may take a while.