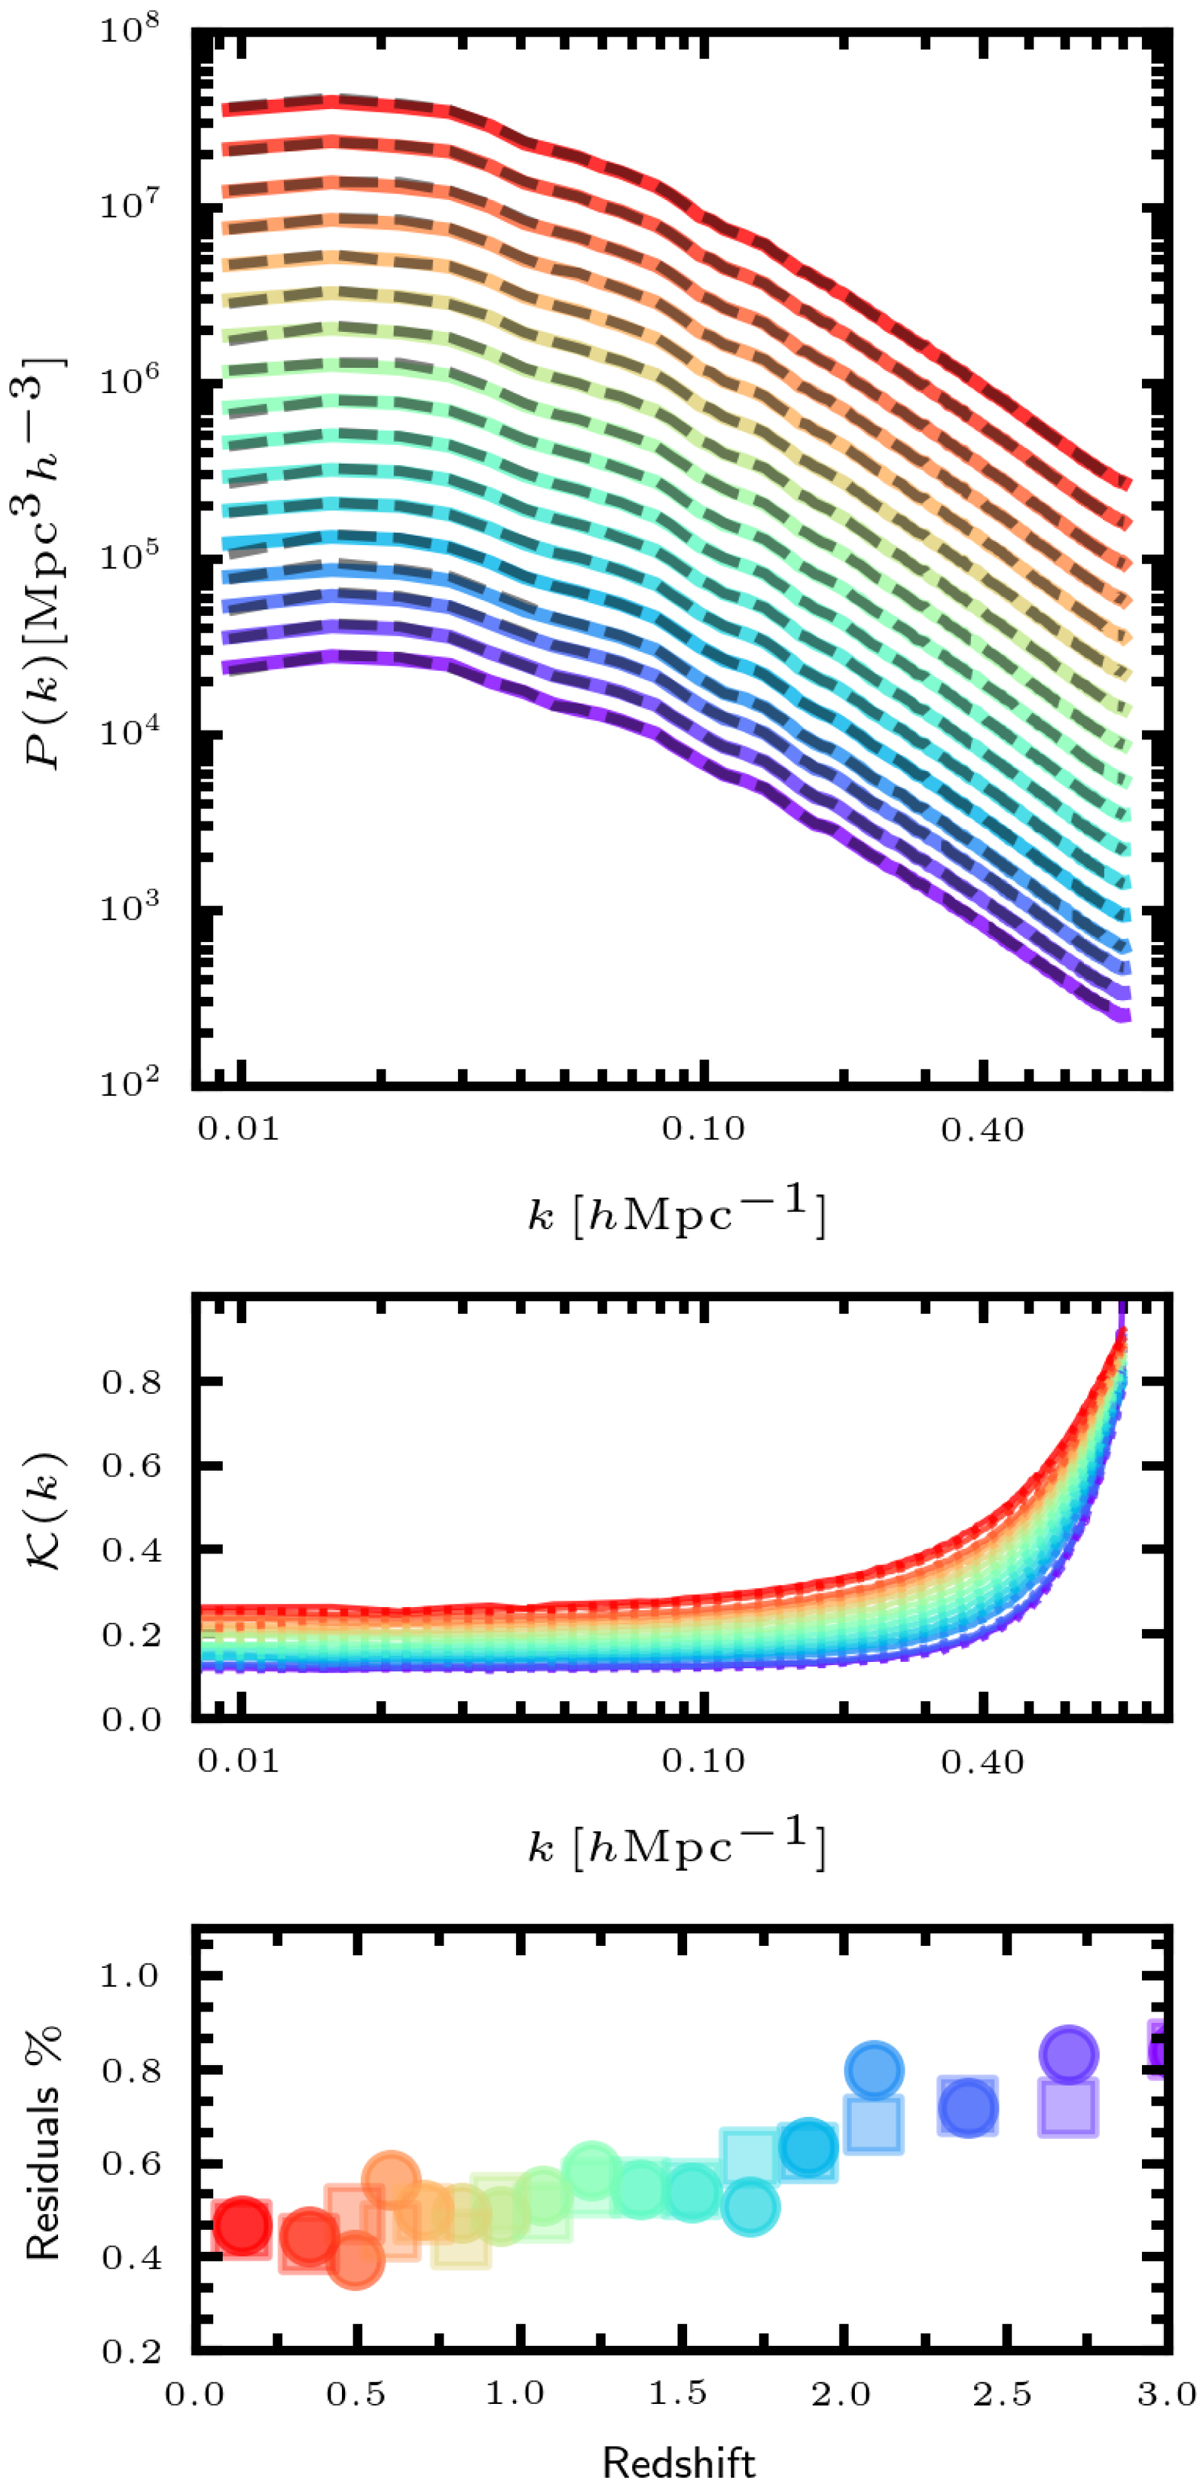
Fig. D.1.
Download original image
Summary statistics of mock halo catalogues generated with BAM using the UNITsim as reference. Top panels: Power spectrum P(k) obtained from learning phase (Sect. 2.7), (solid lines) compared to the same statistics from the reference (dashed lines). Colours indicate different snapshots of the UNIT simulation, ranging from z = 0 (red, upper curves) up to z = 3 (violet, bottom curves). The outputs and references at each redshift have been shifted by the same amount to facilitate the comparison. The middle panel shows the kernel 𝒦 and the bottom panels show the relative residuals in the power spectrum at the different redshifts, obtained from the normal (filled circles) and the phase-inverted (filled squares) reference catalogues.
Current usage metrics show cumulative count of Article Views (full-text article views including HTML views, PDF and ePub downloads, according to the available data) and Abstracts Views on Vision4Press platform.
Data correspond to usage on the plateform after 2015. The current usage metrics is available 48-96 hours after online publication and is updated daily on week days.
Initial download of the metrics may take a while.