Open Access
Fig. 21.
Download original image
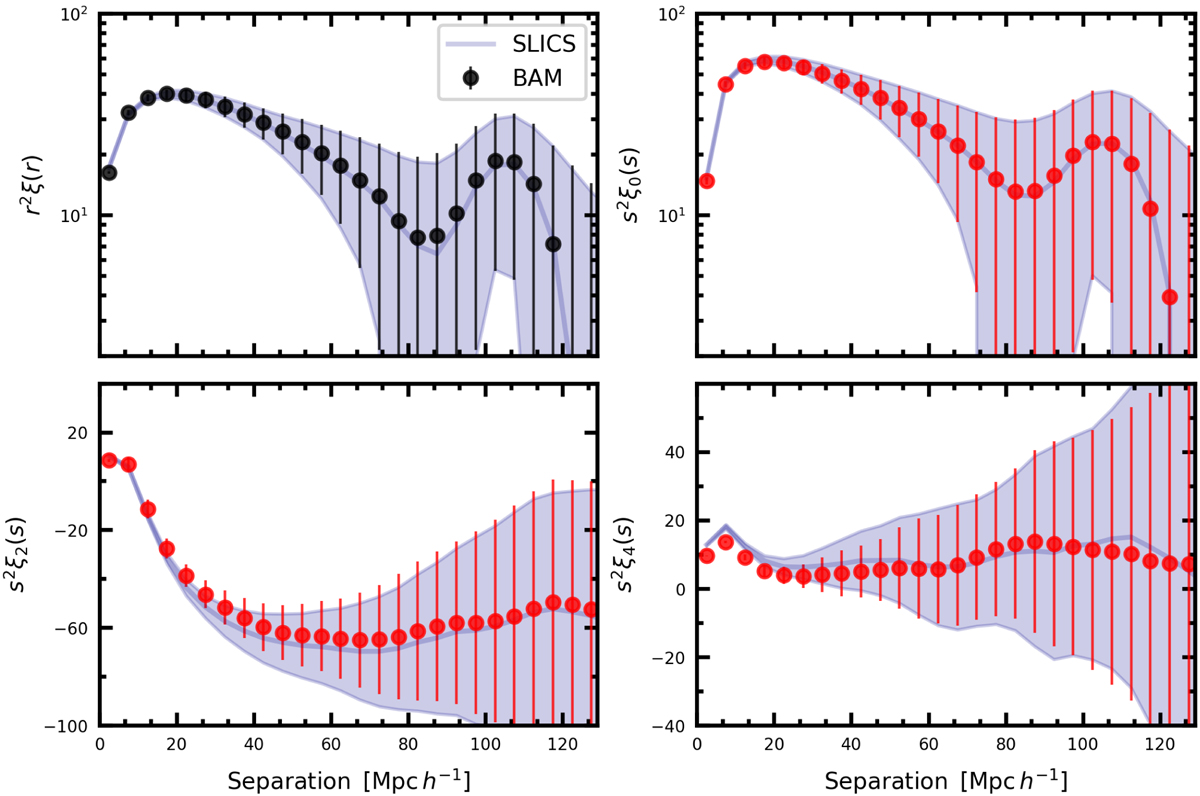
Galaxy correlation function in real space ξ(r), (top panel) and redshift space in the form of monopole ξ0(s), quadrupole ξ2(s), and hexadecapole ξ4(s). The solid line and shaded area denote the mean and sample variance from the SLICS simulation, respectively.
Current usage metrics show cumulative count of Article Views (full-text article views including HTML views, PDF and ePub downloads, according to the available data) and Abstracts Views on Vision4Press platform.
Data correspond to usage on the plateform after 2015. The current usage metrics is available 48-96 hours after online publication and is updated daily on week days.
Initial download of the metrics may take a while.