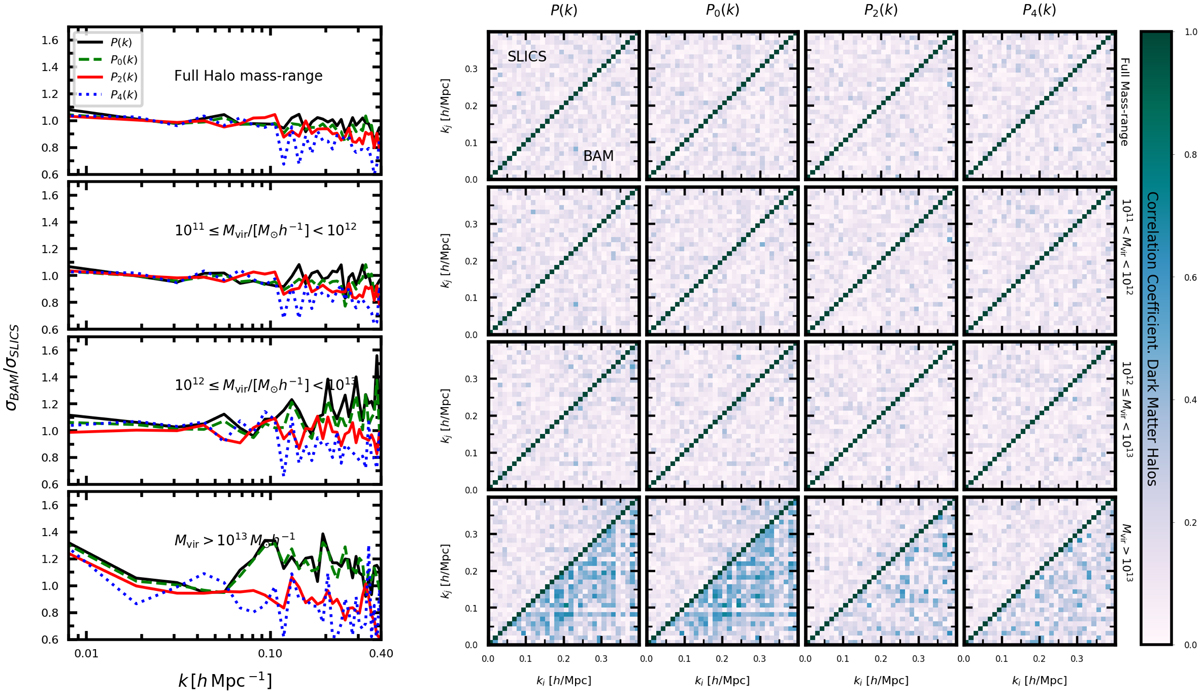
Fig. 15.
Download original image
Correlation matrix of power spectrum. Left column: Ratio between the variance of the power spectrum from the BAM mocks and that measured from the SLICS in different halo-mass bins. Right column: Correlation coefficients obtained from the BAM mock halo catalogues and the SLICS references computed in real and redshift space, with the latter expressed through the monopole P0(k), the quadrupole P2(k), and the hexadecapole P4(k). Three bins of halo mass are shown (rows).
Current usage metrics show cumulative count of Article Views (full-text article views including HTML views, PDF and ePub downloads, according to the available data) and Abstracts Views on Vision4Press platform.
Data correspond to usage on the plateform after 2015. The current usage metrics is available 48-96 hours after online publication and is updated daily on week days.
Initial download of the metrics may take a while.