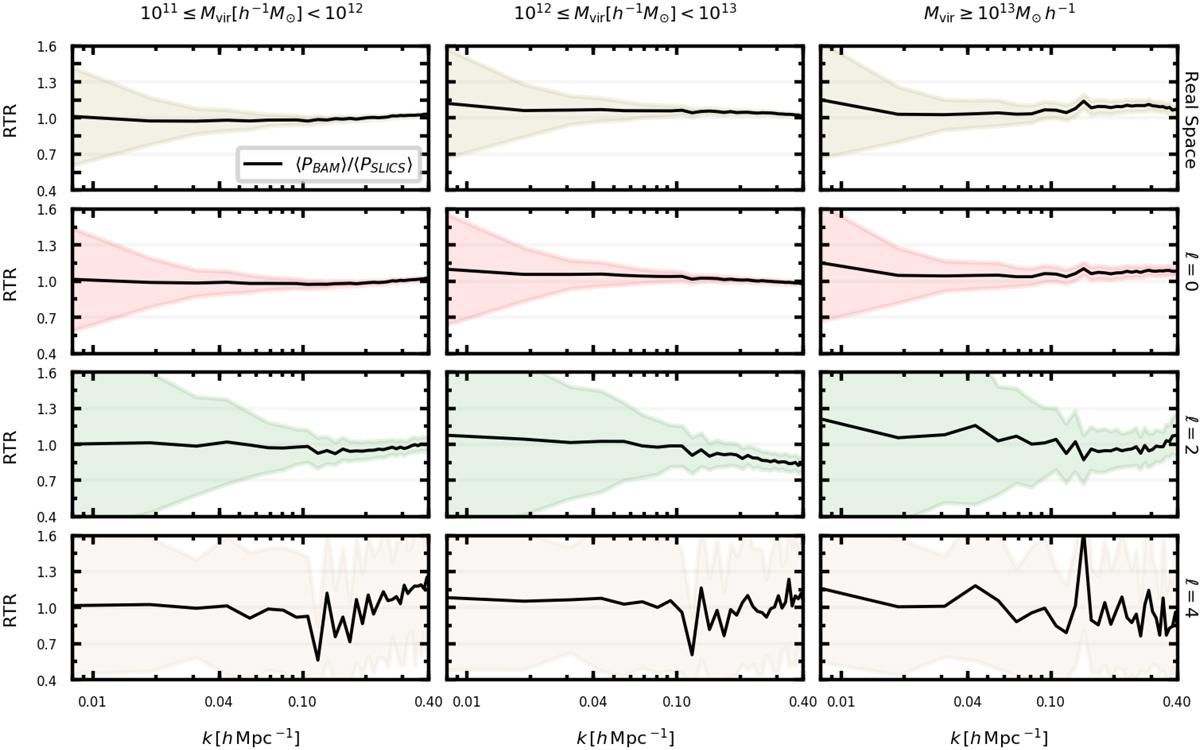
Fig. 14.
Download original image
Ratio (ratio-to-reference) between the mean power spectrum from the set of 80 BAM mock halo catalogues and that obtained from the same number of SLICS catalogues, both in real and redshift space (monopole ℓ = 0, quadrupole ℓ = 2, hexadecapole ℓ = 4), in three bins of halo virial mass. The shaded areas denote the 1σ region (standard deviation) computed from the means and their respective errors.
Current usage metrics show cumulative count of Article Views (full-text article views including HTML views, PDF and ePub downloads, according to the available data) and Abstracts Views on Vision4Press platform.
Data correspond to usage on the plateform after 2015. The current usage metrics is available 48-96 hours after online publication and is updated daily on week days.
Initial download of the metrics may take a while.