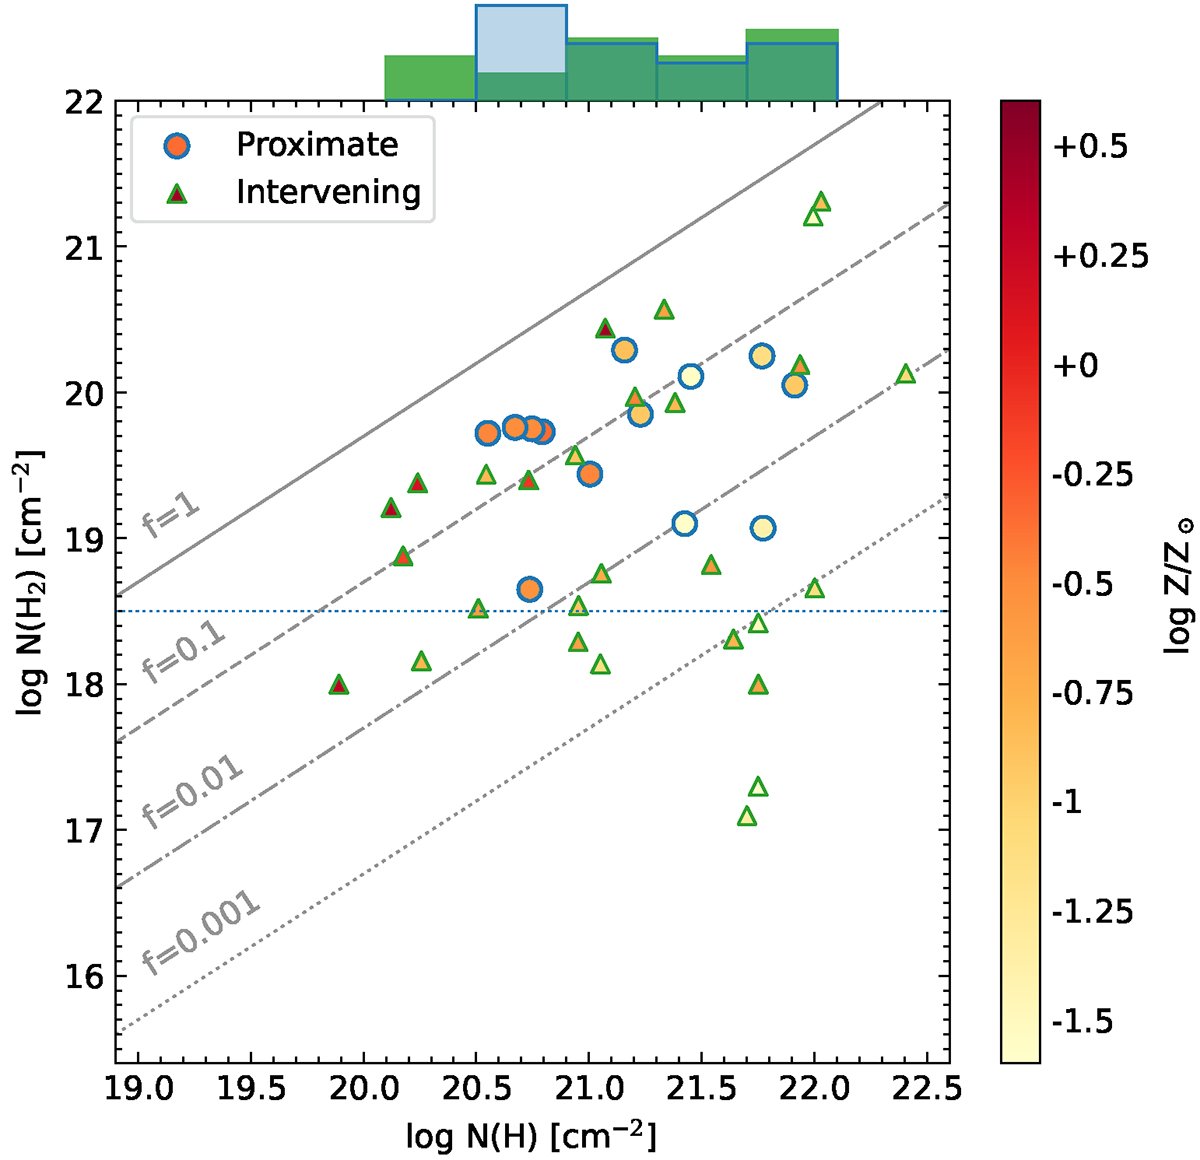
Fig. 8.
Download original image
Column density of molecular hydrogen vs total neutral hydrogen column density N(H I) = N(H I) + 2N(H2) for our sample of proximate H2 absorbers and z > 2 intervening strong H2-bearing DLAs from Balashev et al. (2019). For a fair comparison, we removed systems that may potentially be proximate, and kept only systems with a conservative cut of c (zabs − zQSO)/(1 + zQSO) < − 10 000 km s−1. Our selection of proximate H2 systems based on strong H2 lines directly seen in the low-resolution SDSS spectra naturally skews our sample to high H2 columns. The horizontal blue line shows the approximate and empirical lower limit of at log N(H2) > 18.5 for the present sample. The top histograms show the N(H) distributions for the proximate (blue) and intervening (green) systems with N(H2) > 18.5. Finally, the different lines correspond to different averaged molecular fractions fH2 ≡ 2N(H2)/2N(H2) + N(H I)).
Current usage metrics show cumulative count of Article Views (full-text article views including HTML views, PDF and ePub downloads, according to the available data) and Abstracts Views on Vision4Press platform.
Data correspond to usage on the plateform after 2015. The current usage metrics is available 48-96 hours after online publication and is updated daily on week days.
Initial download of the metrics may take a while.