Fig. 7.
Download original image
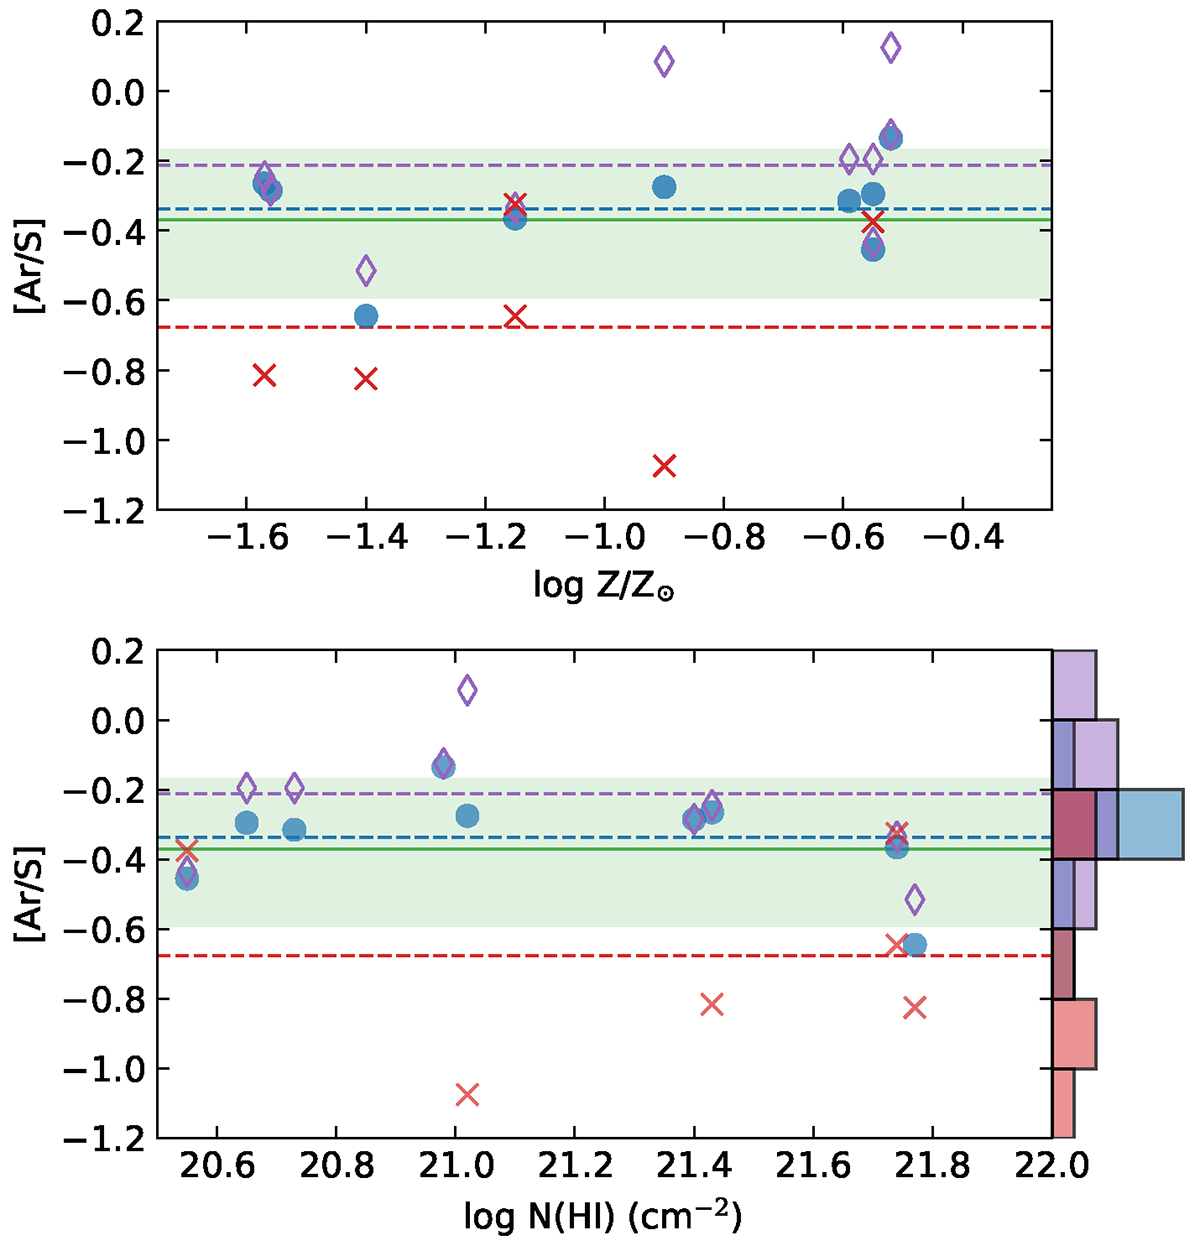
Observed [Ar/S] ratio (based on Ar I and S II) as a function of overall metallicity (top) and H I column density (bottom) in our sample of proximate systems. Blue circles correspond to the overall value in each system, and purple diamonds and red crosses show the H2 and non-H2 components, respectively. The dashed lines correspond to the corresponding mean values. The distribution is shown in the side panel. The green line corresponds to the mean [Ar/S] value (corrected to the same solar reference) and dispersion for intervening DLAs (Zafar et al. 2014b). Even though we tried to take blends into account, all points should be considered as upper limits in principle.
Current usage metrics show cumulative count of Article Views (full-text article views including HTML views, PDF and ePub downloads, according to the available data) and Abstracts Views on Vision4Press platform.
Data correspond to usage on the plateform after 2015. The current usage metrics is available 48-96 hours after online publication and is updated daily on week days.
Initial download of the metrics may take a while.