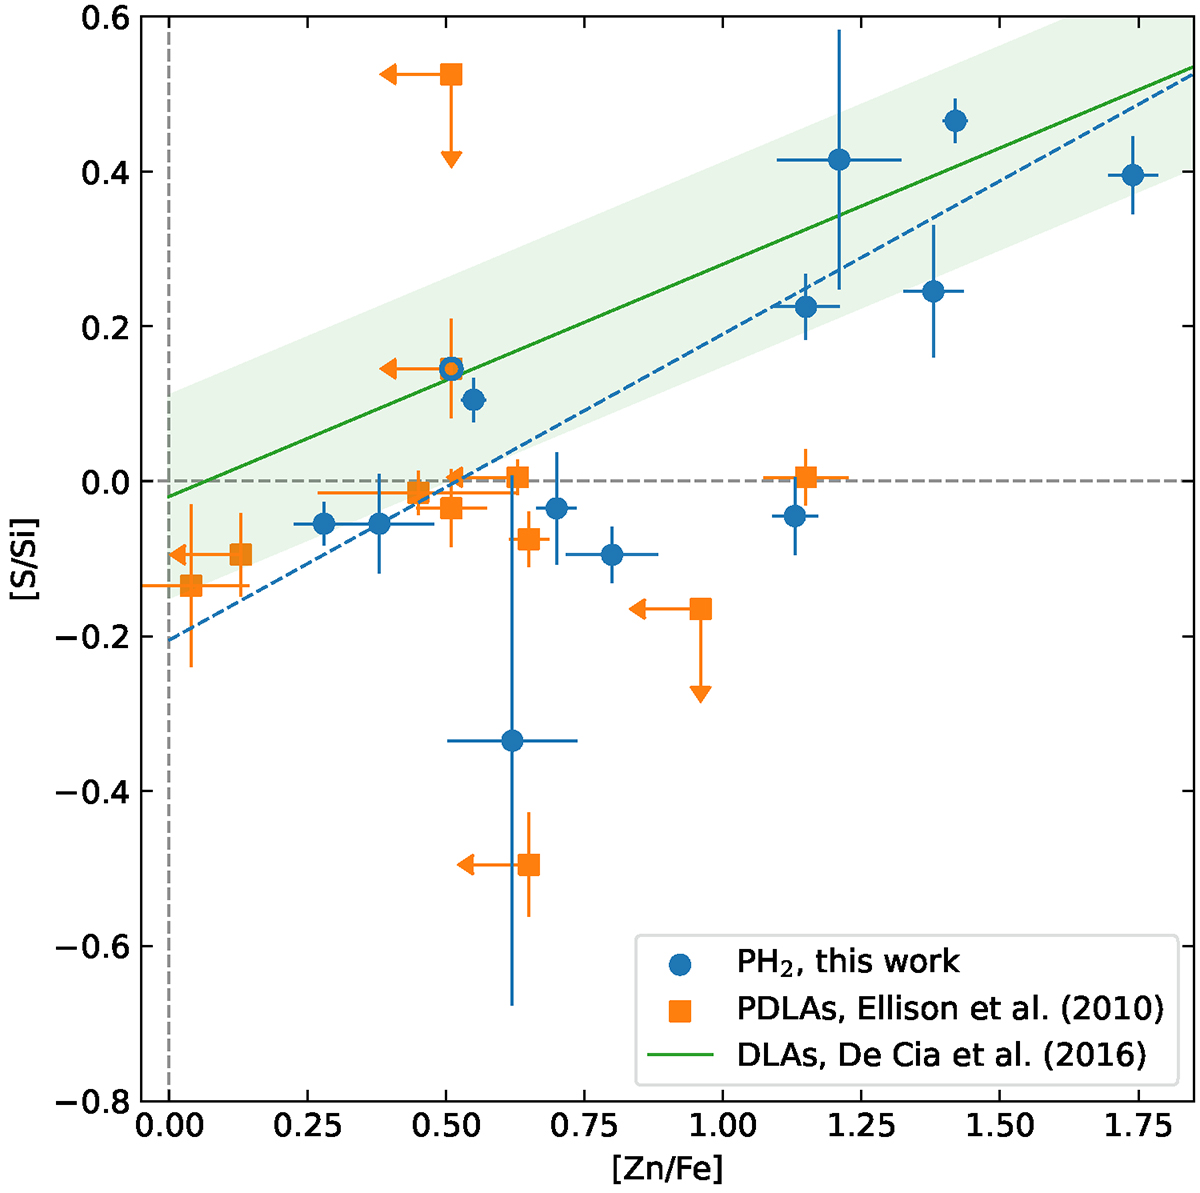
Fig. 6.
Download original image
Sulphur-to-silicon vs zinc-to-iron abundance ratios in proximate H2 and DLA systems. The green line and shaded area represent the best fit for intervening DLAs by De Cia et al. (2016) and the 1σ scatter around this relation. The dashed blue line is a linear fit to the proximate H2 data. Dashed vertical and horizontal lines mark solar values. Symbols and colours for data points are as in Fig. 5.
Current usage metrics show cumulative count of Article Views (full-text article views including HTML views, PDF and ePub downloads, according to the available data) and Abstracts Views on Vision4Press platform.
Data correspond to usage on the plateform after 2015. The current usage metrics is available 48-96 hours after online publication and is updated daily on week days.
Initial download of the metrics may take a while.