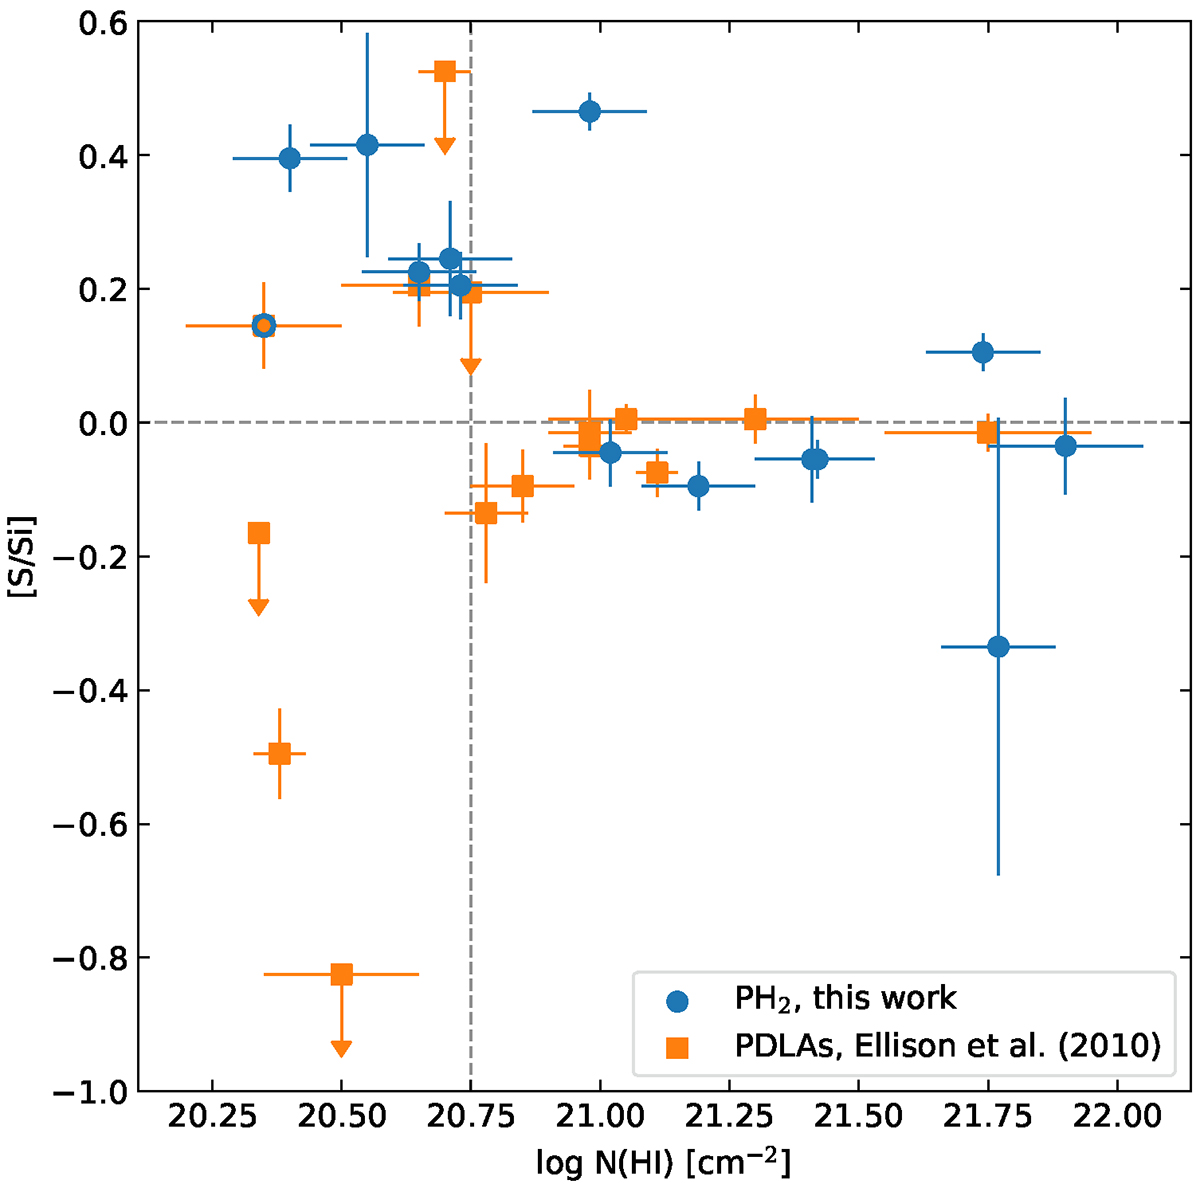
Fig. 5.
Download original image
Sulphur-to-silicon abundance ratio vs H I column density. The horizontal dashed line marks the solar ratio, and the vertical line shows the N(H I) limit below which Ellison et al. (2010) observed lower-than-solar abundances in PDLAs (see text). While not in our sample of proximate H2, one PDLA from Ellison et al. (2010), namely J2340-00, also has strong H2 and is marked with a blue circle.
Current usage metrics show cumulative count of Article Views (full-text article views including HTML views, PDF and ePub downloads, according to the available data) and Abstracts Views on Vision4Press platform.
Data correspond to usage on the plateform after 2015. The current usage metrics is available 48-96 hours after online publication and is updated daily on week days.
Initial download of the metrics may take a while.