Open Access
Fig. E.1.
Download original image
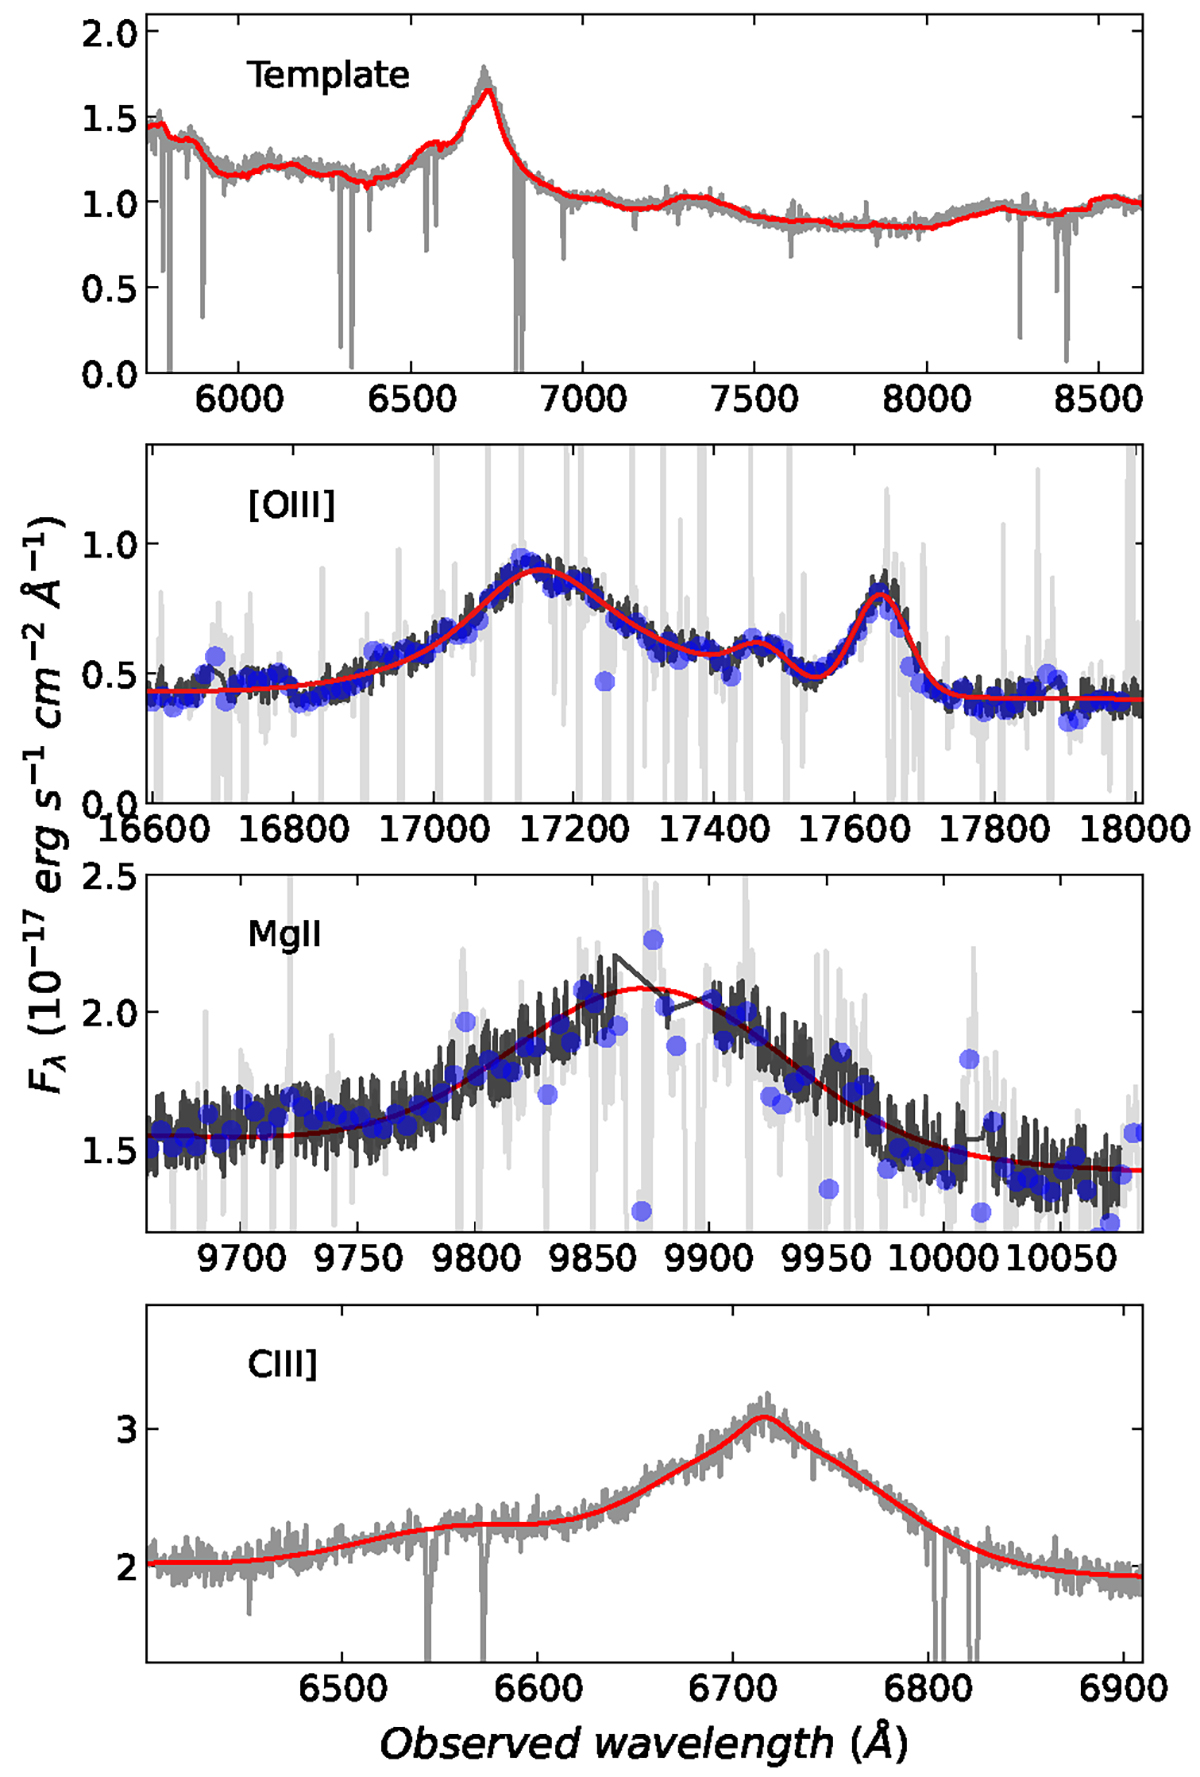
Emission lines from J0019–0137, detected in the visual and near-infrared. In the case of NIR, we show in dark grey the spectrum after iteratively rejecting deviant points. Blue dots show the median in 20-pixel bins. The best-fit model is shown by the solid red line.
Current usage metrics show cumulative count of Article Views (full-text article views including HTML views, PDF and ePub downloads, according to the available data) and Abstracts Views on Vision4Press platform.
Data correspond to usage on the plateform after 2015. The current usage metrics is available 48-96 hours after online publication and is updated daily on week days.
Initial download of the metrics may take a while.