Open Access
Fig. D.1.
Download original image
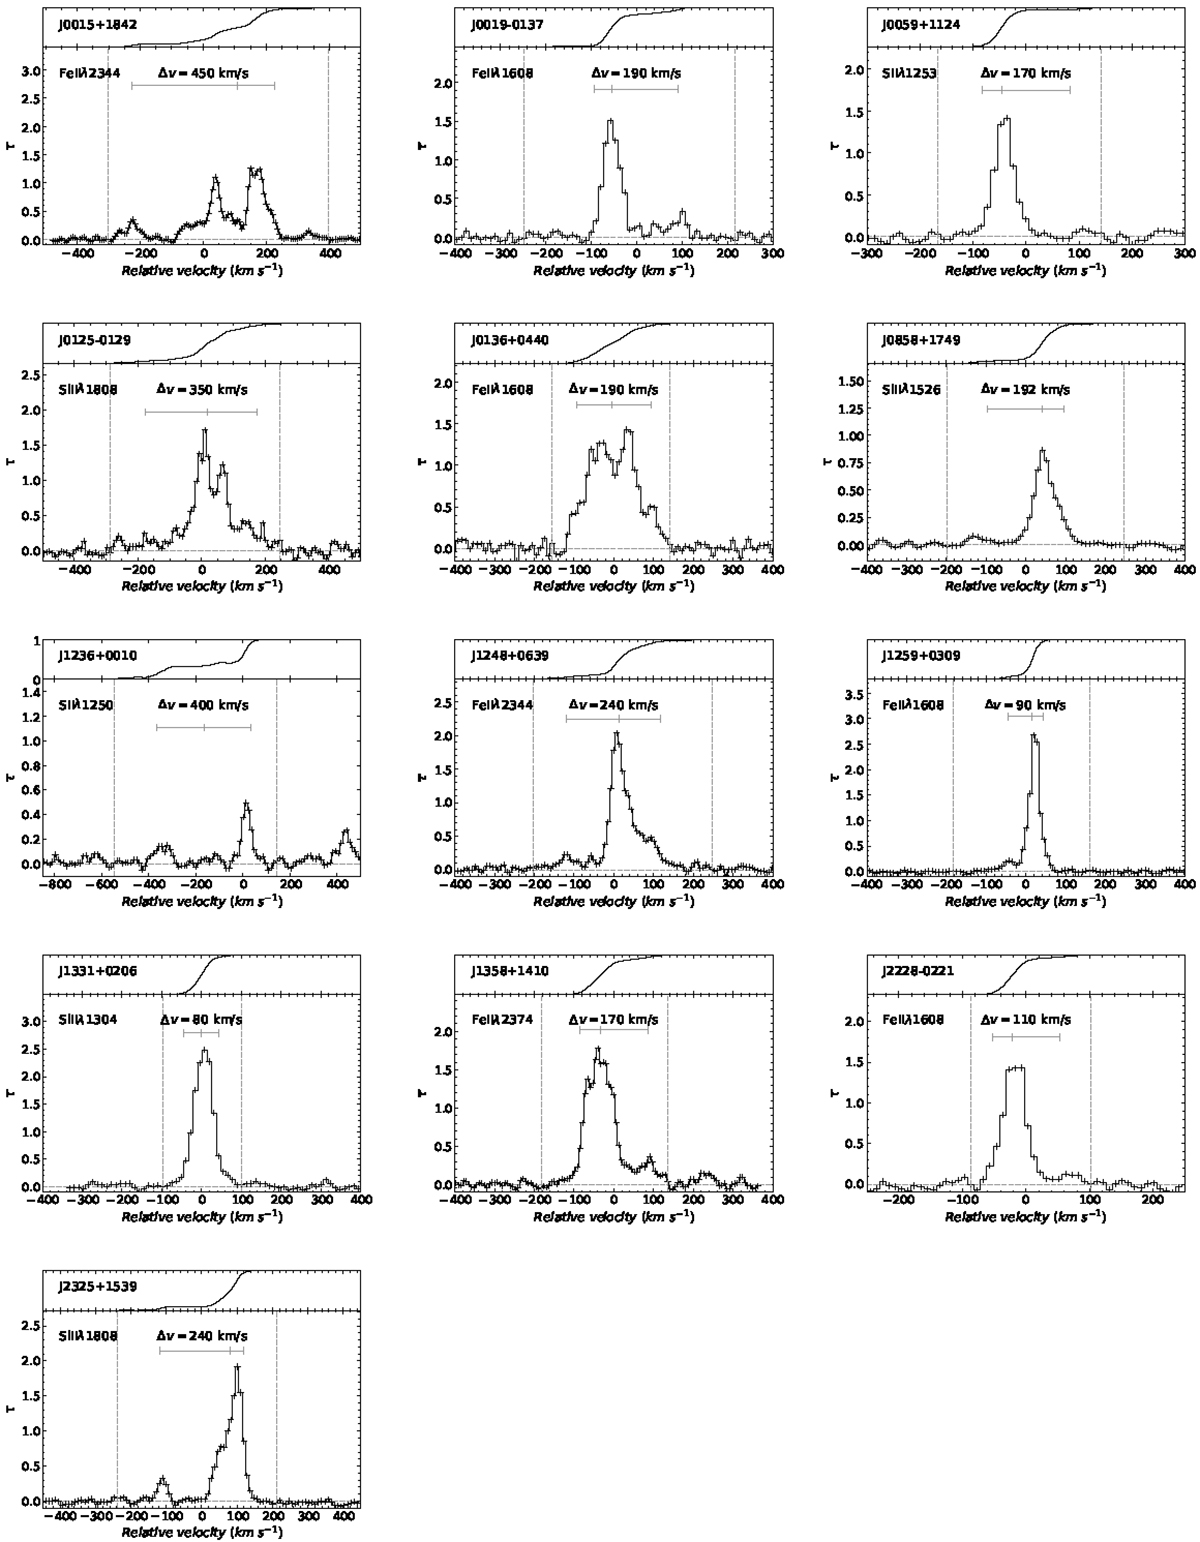
Measurements of Δv90 for low-ionisation line profiles. The different panels show the apparent optical depth (τ) in the selected transition line for a given system, and the cumulative apparent optical depth is shown on top. The segments represent the locations of the 5%, 50%, and 95% percentiles.
Current usage metrics show cumulative count of Article Views (full-text article views including HTML views, PDF and ePub downloads, according to the available data) and Abstracts Views on Vision4Press platform.
Data correspond to usage on the plateform after 2015. The current usage metrics is available 48-96 hours after online publication and is updated daily on week days.
Initial download of the metrics may take a while.