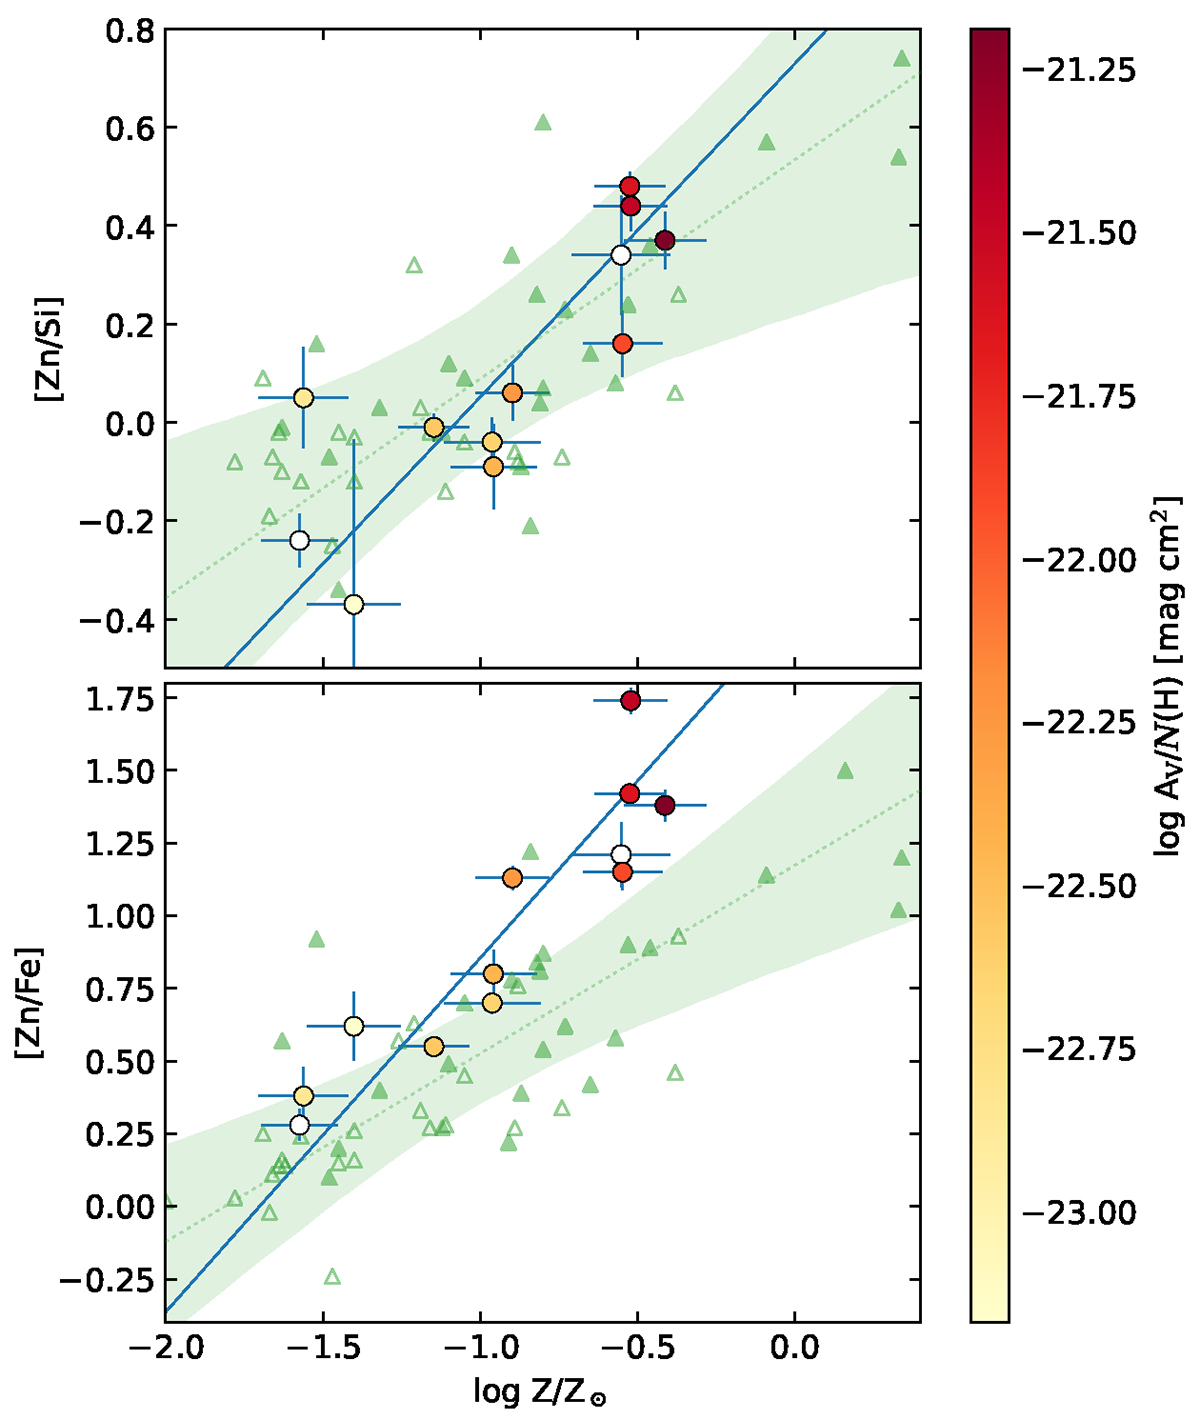
Fig. 3.
Download original image
Zinc-to-iron (bottom) and zinc-to-silicon (top) ratio for our sample of proximate H2 systems (circles with error bars). The colour scale provides the value of AV/N(H), which is a proxy of the dust-to-gas ratio. For two systems, the derived AV values are negative (hence unphysical) and the corresponding points are empty. Green triangles represent measurements in intervening DLAs (De Cia et al. 2016), and filled triangles correspond to known H2 intervening systems (Balashev et al. 2019). The solid blue lines show the best linear fit to the value for the proximate H2 systems, taking uncertainties on both axes into account. The green lines and shadowed region show the best linear fit and associated 1σ uncertainty for the overall sample of intervening DLAs.
Current usage metrics show cumulative count of Article Views (full-text article views including HTML views, PDF and ePub downloads, according to the available data) and Abstracts Views on Vision4Press platform.
Data correspond to usage on the plateform after 2015. The current usage metrics is available 48-96 hours after online publication and is updated daily on week days.
Initial download of the metrics may take a while.