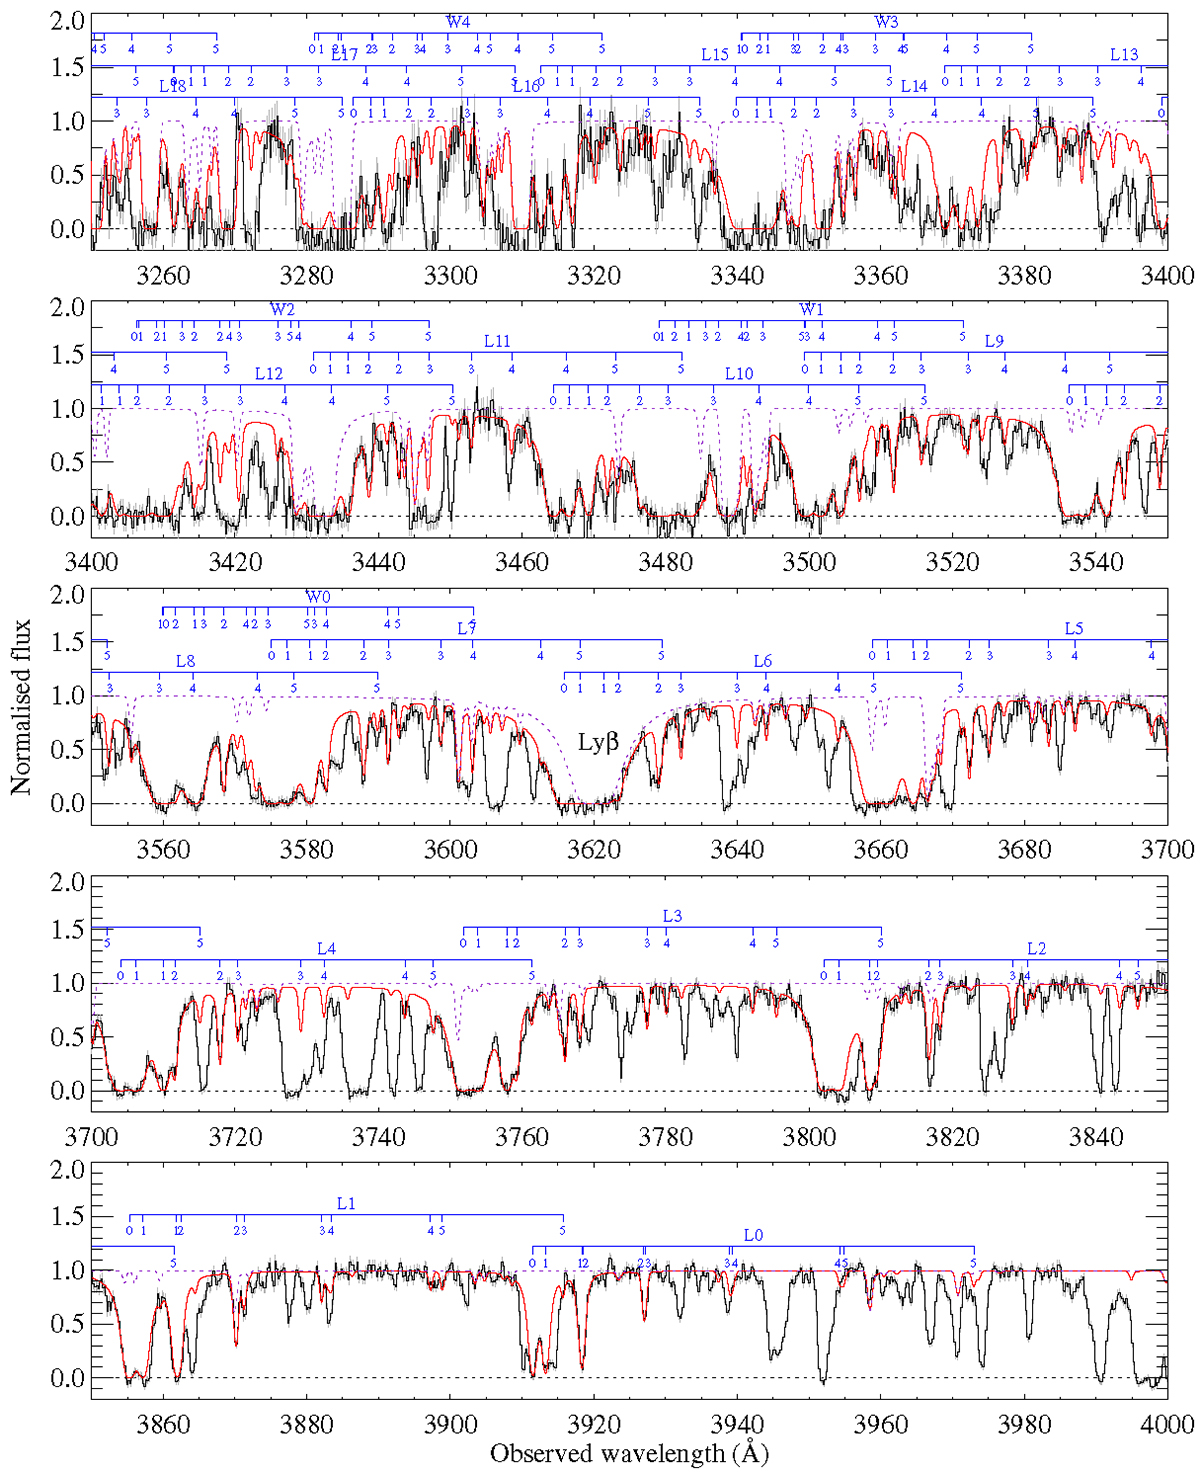
Fig. A.2.
Download original image
Portion of an X-shooter spectrum of J0019–0137 featuring H2 absorption bands. The solid red line shows the overall absorption model, and the contribution from non-H2 lines (H I, metals and lines from intervening systems) is shown as a dashed profile. The blue segments connect lines from different rotational levels (shown here for convenience from J = 0 to J = 5) of a given band (indicated by the label above, ’L’ for Lyman, ’W’ for Werner, and the following number is the upper vibrational level.
Current usage metrics show cumulative count of Article Views (full-text article views including HTML views, PDF and ePub downloads, according to the available data) and Abstracts Views on Vision4Press platform.
Data correspond to usage on the plateform after 2015. The current usage metrics is available 48-96 hours after online publication and is updated daily on week days.
Initial download of the metrics may take a while.