Fig. A.1.
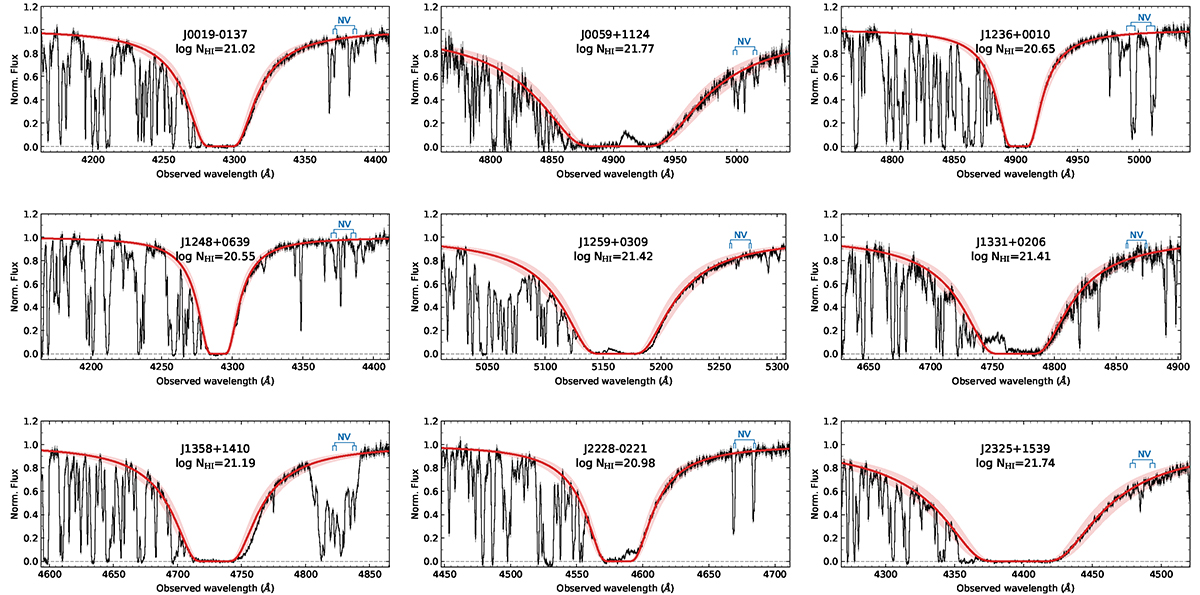
Download original image
Damped H I-Ly-α lines for the proximate H2 systems. The X-shooter data are shown in black, and the profile corresponding to best fit is shown in red. The red shadows represent the conservative range of N(H I), including continuum placement uncertainties. There is residual Ly-α emission in the core of several DLAs. We also mark the expected position of the N Vλλ1238, 1242 doublet in blue. The tick marks represent the range seen in low-ionisation species (i.e. z5 and z95). It is here detected in all cases but J1259+0309 and J1331+0206.
Current usage metrics show cumulative count of Article Views (full-text article views including HTML views, PDF and ePub downloads, according to the available data) and Abstracts Views on Vision4Press platform.
Data correspond to usage on the plateform after 2015. The current usage metrics is available 48-96 hours after online publication and is updated daily on week days.
Initial download of the metrics may take a while.