Fig. 11.
Download original image
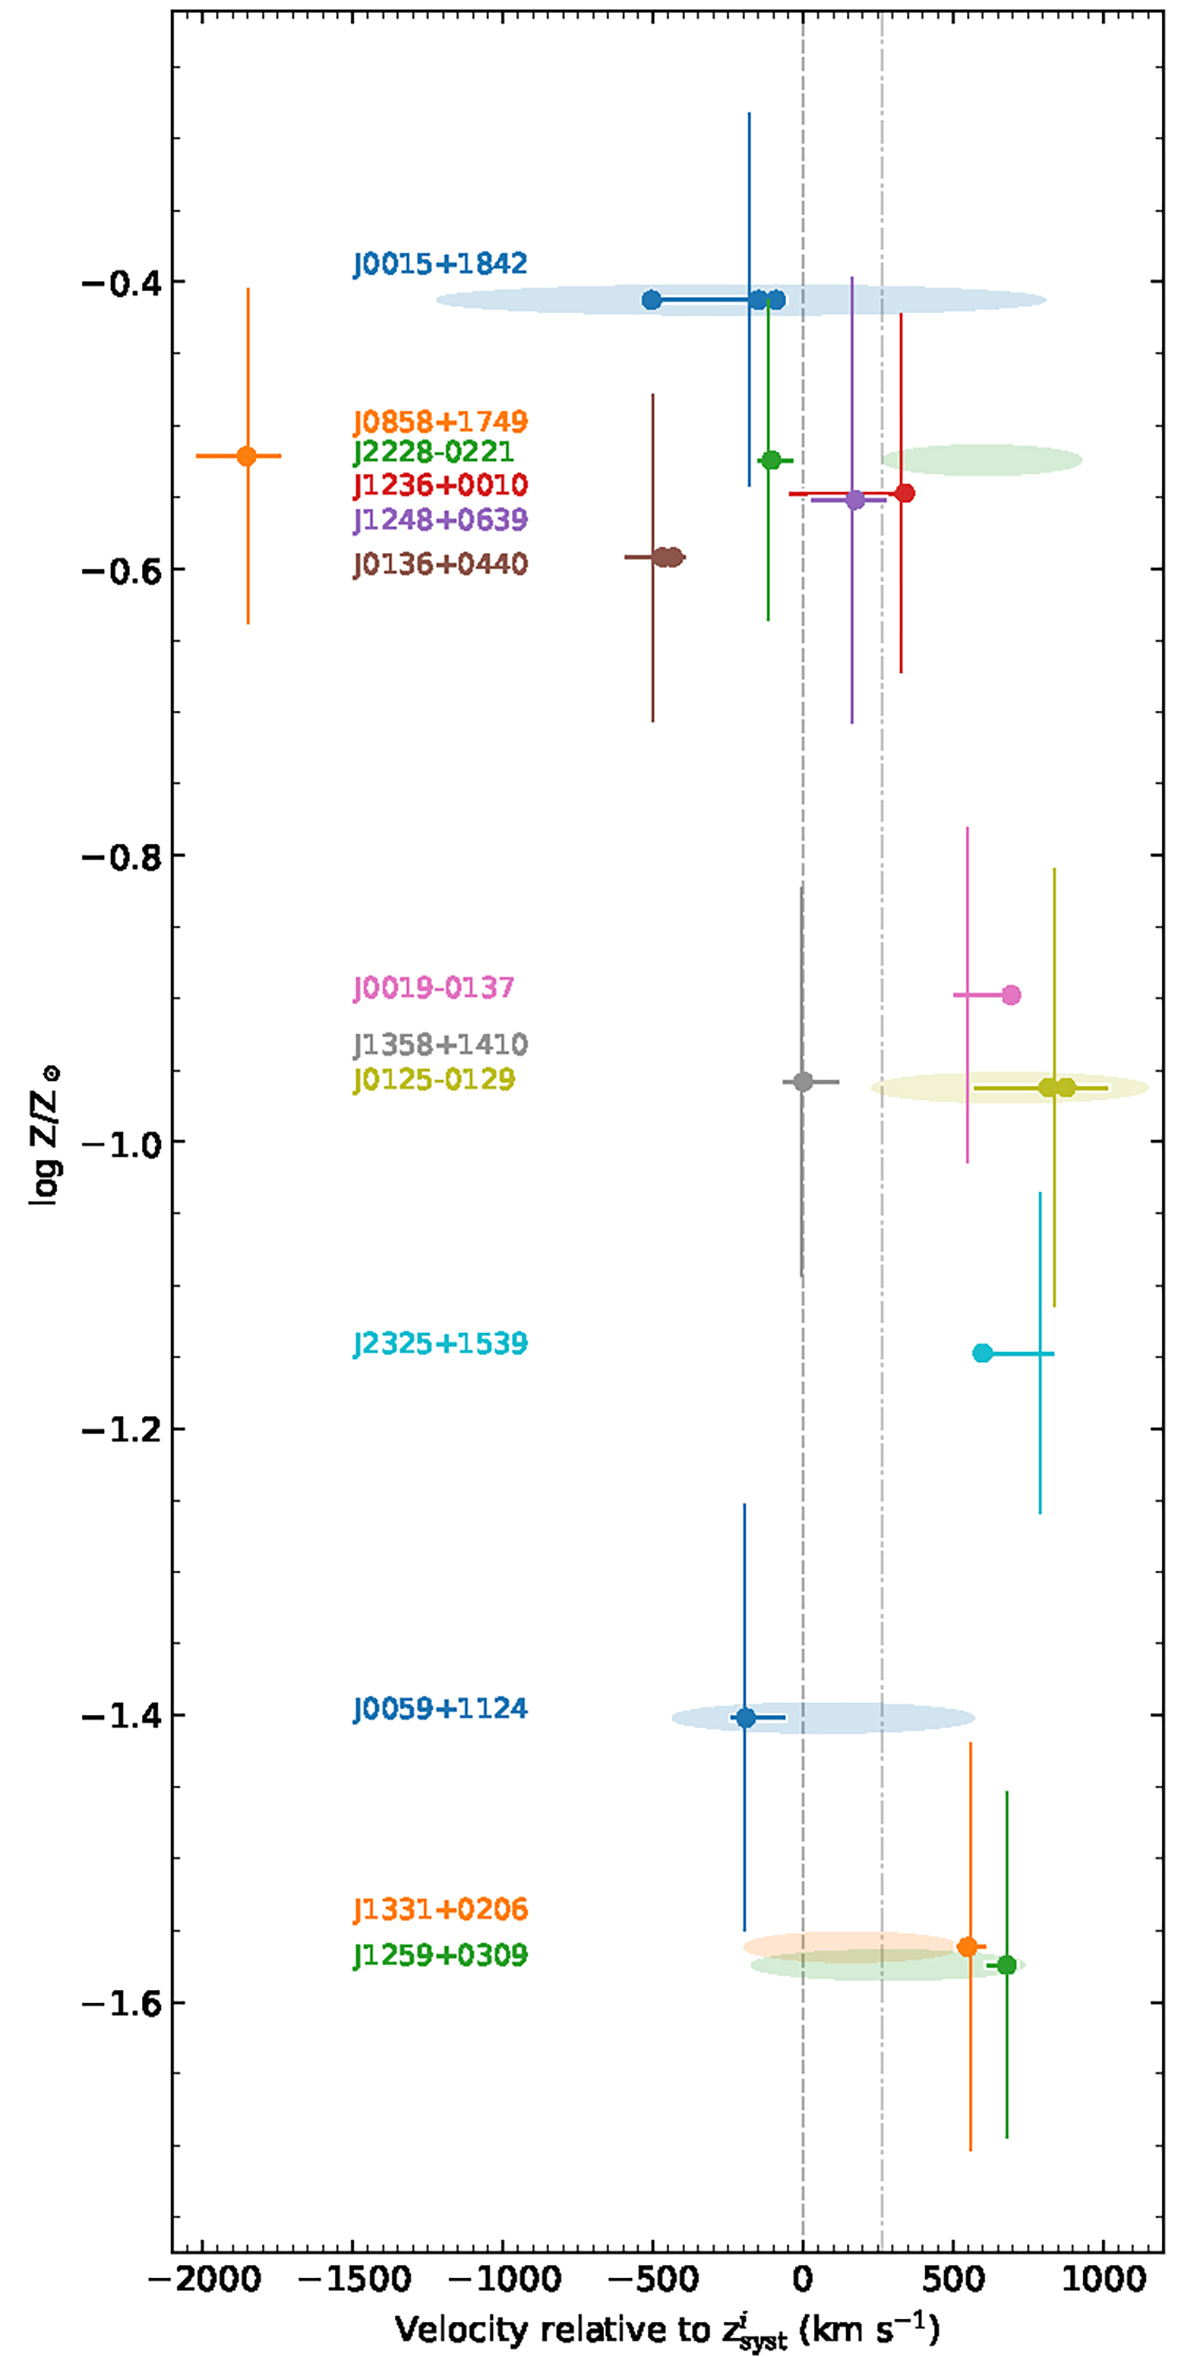
Summary of absorbing gas metallicity and kinematics. The differently coloured segments represent the Δv90 regions, and dots indicate the location of H2 components. The zero of the velocity scale is set to the best estimate of the systemic redshift zsys from ionised lines (Sect. 4.2). Positive velocities mean here ![]() . Ellipses are shown at the location of the CO(3-2) emission whenever observed, and the major axis is equal to the line FWHM. zCO is shifted with respect to
. Ellipses are shown at the location of the CO(3-2) emission whenever observed, and the major axis is equal to the line FWHM. zCO is shifted with respect to ![]() by about 250 km s−1 on average (dash-dotted line).
by about 250 km s−1 on average (dash-dotted line).
Current usage metrics show cumulative count of Article Views (full-text article views including HTML views, PDF and ePub downloads, according to the available data) and Abstracts Views on Vision4Press platform.
Data correspond to usage on the plateform after 2015. The current usage metrics is available 48-96 hours after online publication and is updated daily on week days.
Initial download of the metrics may take a while.