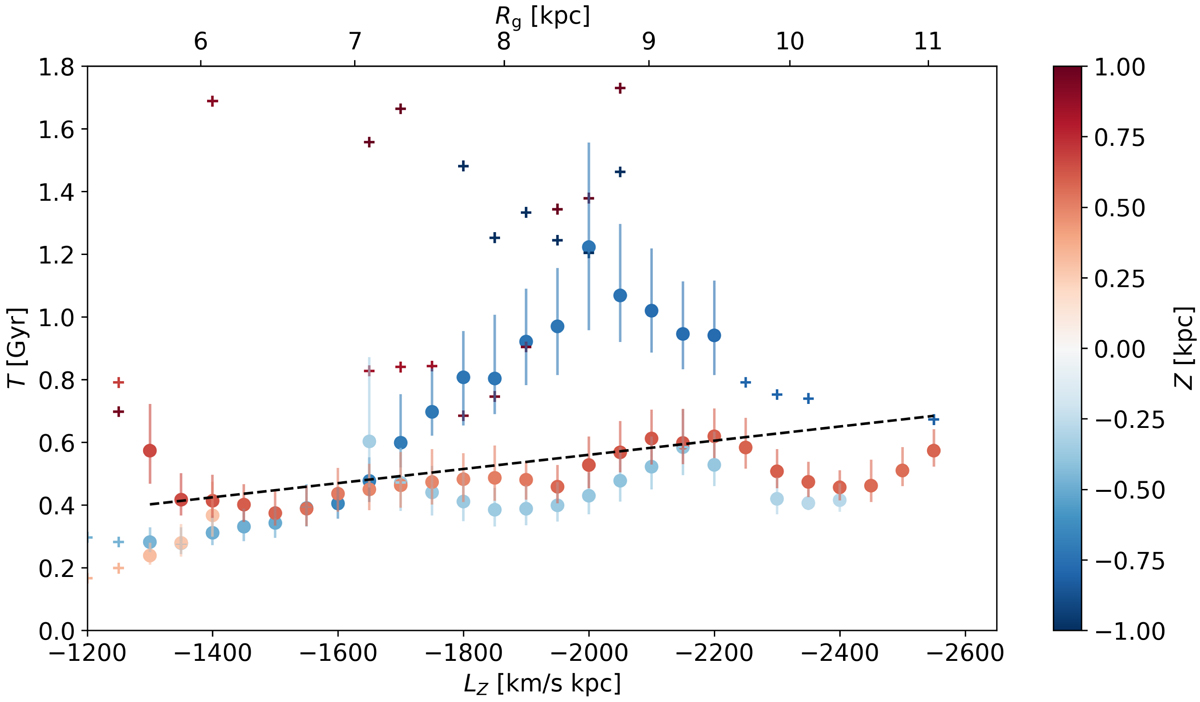
Fig. 8.
Download original image
Time of the start of phase mixing as a function of angular momentum. The symbols give the time inferred from Eq. (2) for the different consecutive plus symbols points of the phase spiral and are coloured by height above the plane. The circles with error bars are the points that we consider valid while plus symbols are the remaining cases. An indicative guiding radius corresponding to the circular velocity curve of the McM17 potential is given in the upper horizontal axis. The dashed line marks a linear fit to the data points.
Current usage metrics show cumulative count of Article Views (full-text article views including HTML views, PDF and ePub downloads, according to the available data) and Abstracts Views on Vision4Press platform.
Data correspond to usage on the plateform after 2015. The current usage metrics is available 48-96 hours after online publication and is updated daily on week days.
Initial download of the metrics may take a while.