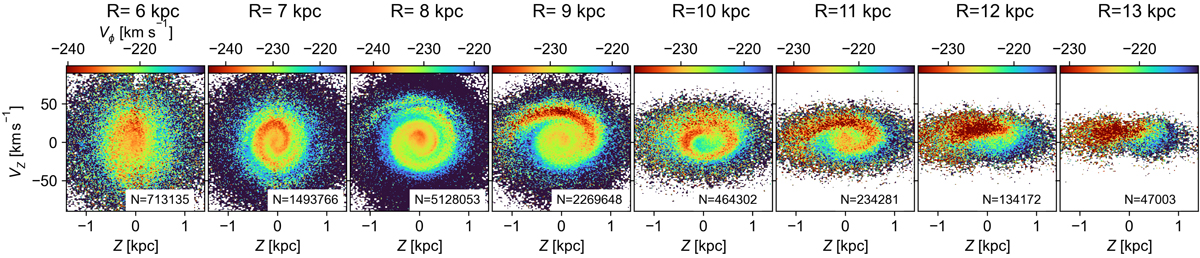
Fig. 3.
Download original image
Phase spiral at different Galactocentric radii with Gaia DR3 data. The panels show the vertical projection of phase space (Z–VZ) coloured by median Vϕ. We only use stars with |ϕ|< 20deg. The regions have a total radial width of 1 kpc and their centres are separated by the same amount. We used bins of ΔZ = 0.02 kpc and ΔVZ = 1 km s−1. The colour-map ranges correspond to the percentiles 30 and 70 of the distribution of Vϕ in each volume in order to maximise the appearance of the spiral. We indicate the number of stars in the bottom part of the panels.
Current usage metrics show cumulative count of Article Views (full-text article views including HTML views, PDF and ePub downloads, according to the available data) and Abstracts Views on Vision4Press platform.
Data correspond to usage on the plateform after 2015. The current usage metrics is available 48-96 hours after online publication and is updated daily on week days.
Initial download of the metrics may take a while.