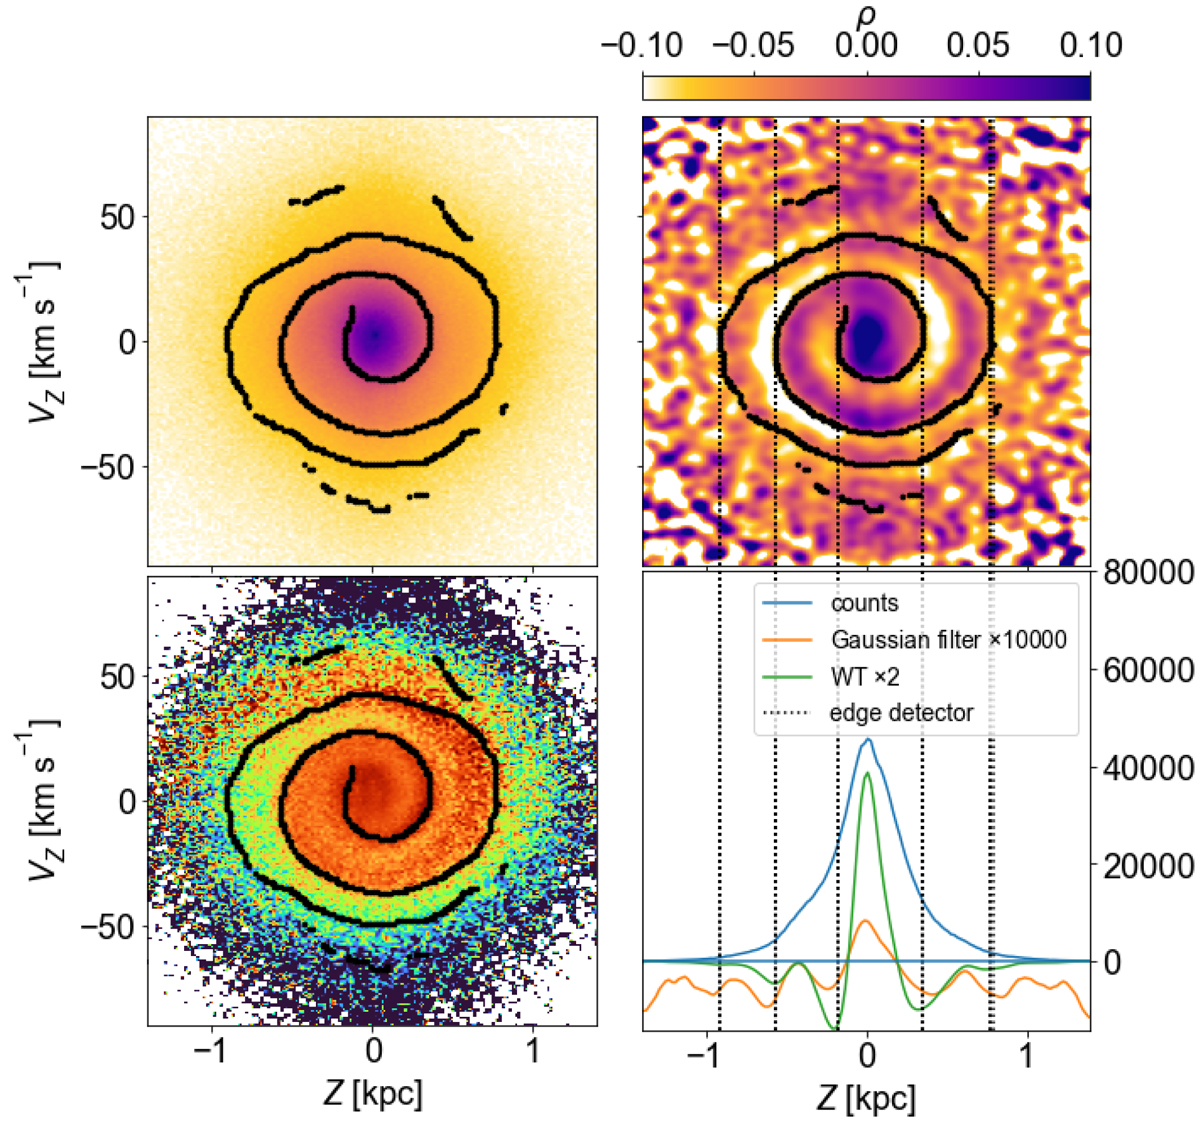
Fig. 2.
Download original image
Phase spiral detected by the edge detection. Top left: output of the algorithm applied to the same selection of stars as in Fig. 1, superposed to the counts from which it was computed. We used σ = 3. Bottom left: same but superposed to the projection coloured according to Vϕ. Top right: comparison with the Gaussian filter (colour, see text). Bottom right: comparison with the Gaussian filter and the WT, with the respective values scaled to fit in the same plot, as indicated in the legend, in a one-dimensional case (see text).
Current usage metrics show cumulative count of Article Views (full-text article views including HTML views, PDF and ePub downloads, according to the available data) and Abstracts Views on Vision4Press platform.
Data correspond to usage on the plateform after 2015. The current usage metrics is available 48-96 hours after online publication and is updated daily on week days.
Initial download of the metrics may take a while.