Open Access
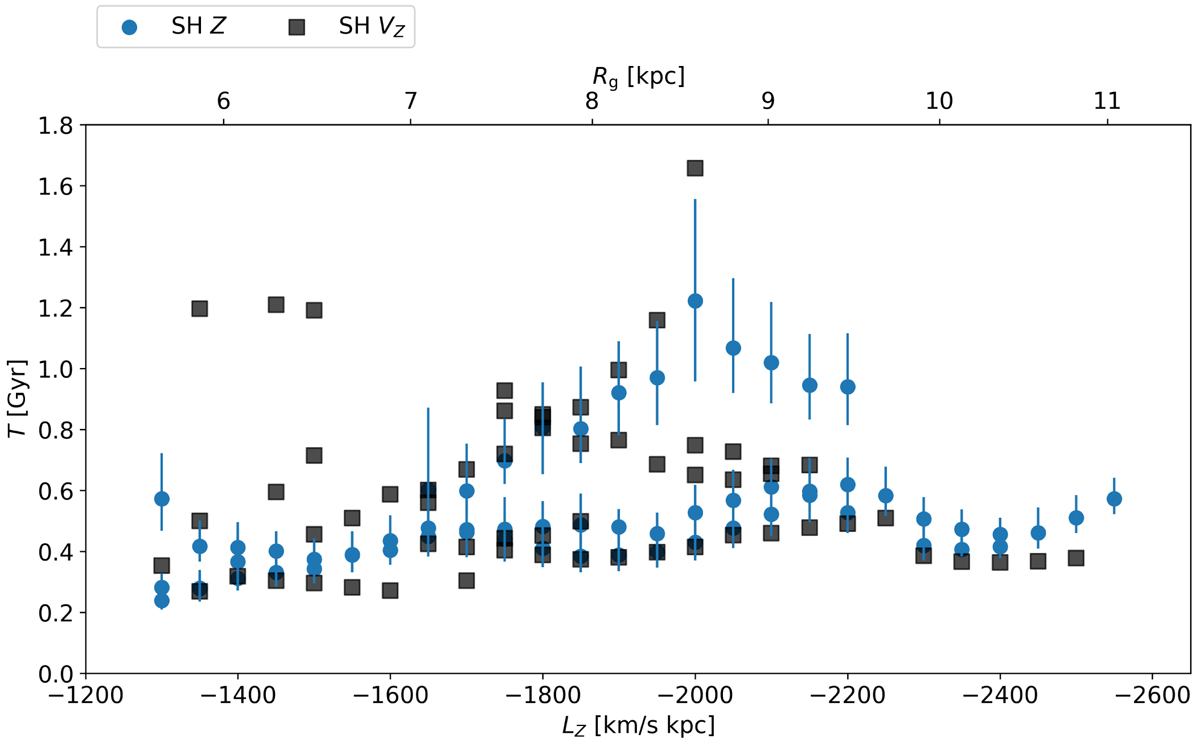
Fig. 13.
Download original image
Time of the start of phase mixing for different parts of the phase spiral. The figure is similar to Fig. 8 but we use the fiducial case (blue dots) computed from Zc but also from VZ c (grey squares) to derive the times, as indicated in the legend.
Current usage metrics show cumulative count of Article Views (full-text article views including HTML views, PDF and ePub downloads, according to the available data) and Abstracts Views on Vision4Press platform.
Data correspond to usage on the plateform after 2015. The current usage metrics is available 48-96 hours after online publication and is updated daily on week days.
Initial download of the metrics may take a while.