Fig. 1.
Download original image
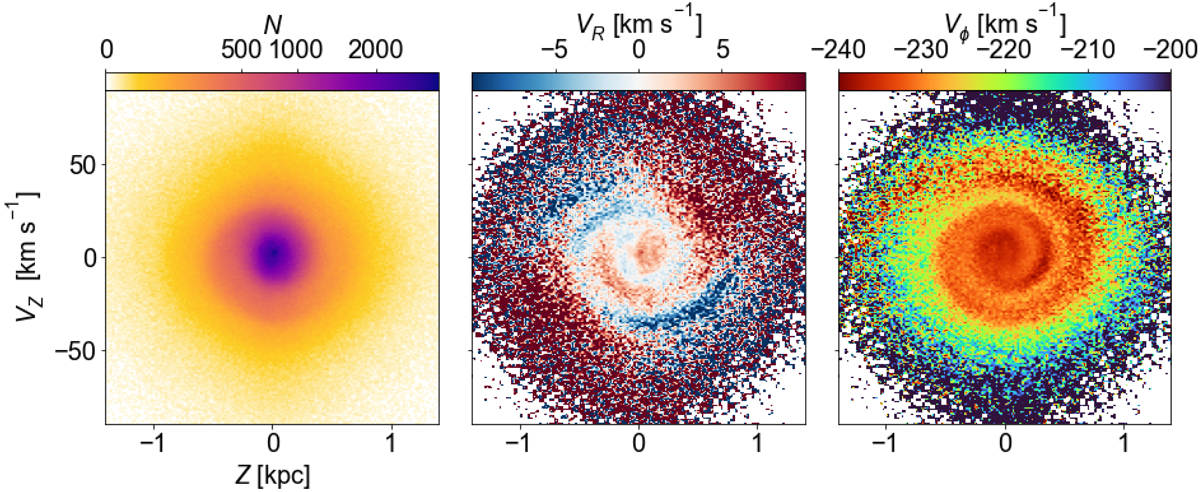
Phase spiral in the solar neighbourhood with Gaia DR3 data. Left: two-dimensional histogram of the vertical projection of phase space (Z–VZ) from the sample of stars with Galactocentric radii of R⊙ ± 0.1 kpc and ϕ = 0 ± 20deg. We used bins of ΔZ = 0.02 kpc and ΔVZ = 1 km s−1. Middle: same projection but colour coded according to median radial velocity VR. Right: same projection but colour-coded according to median azimuthal velocity Vϕ, adjusting the colour bar limits so as to maximise the appearance of the spiral.
Current usage metrics show cumulative count of Article Views (full-text article views including HTML views, PDF and ePub downloads, according to the available data) and Abstracts Views on Vision4Press platform.
Data correspond to usage on the plateform after 2015. The current usage metrics is available 48-96 hours after online publication and is updated daily on week days.
Initial download of the metrics may take a while.