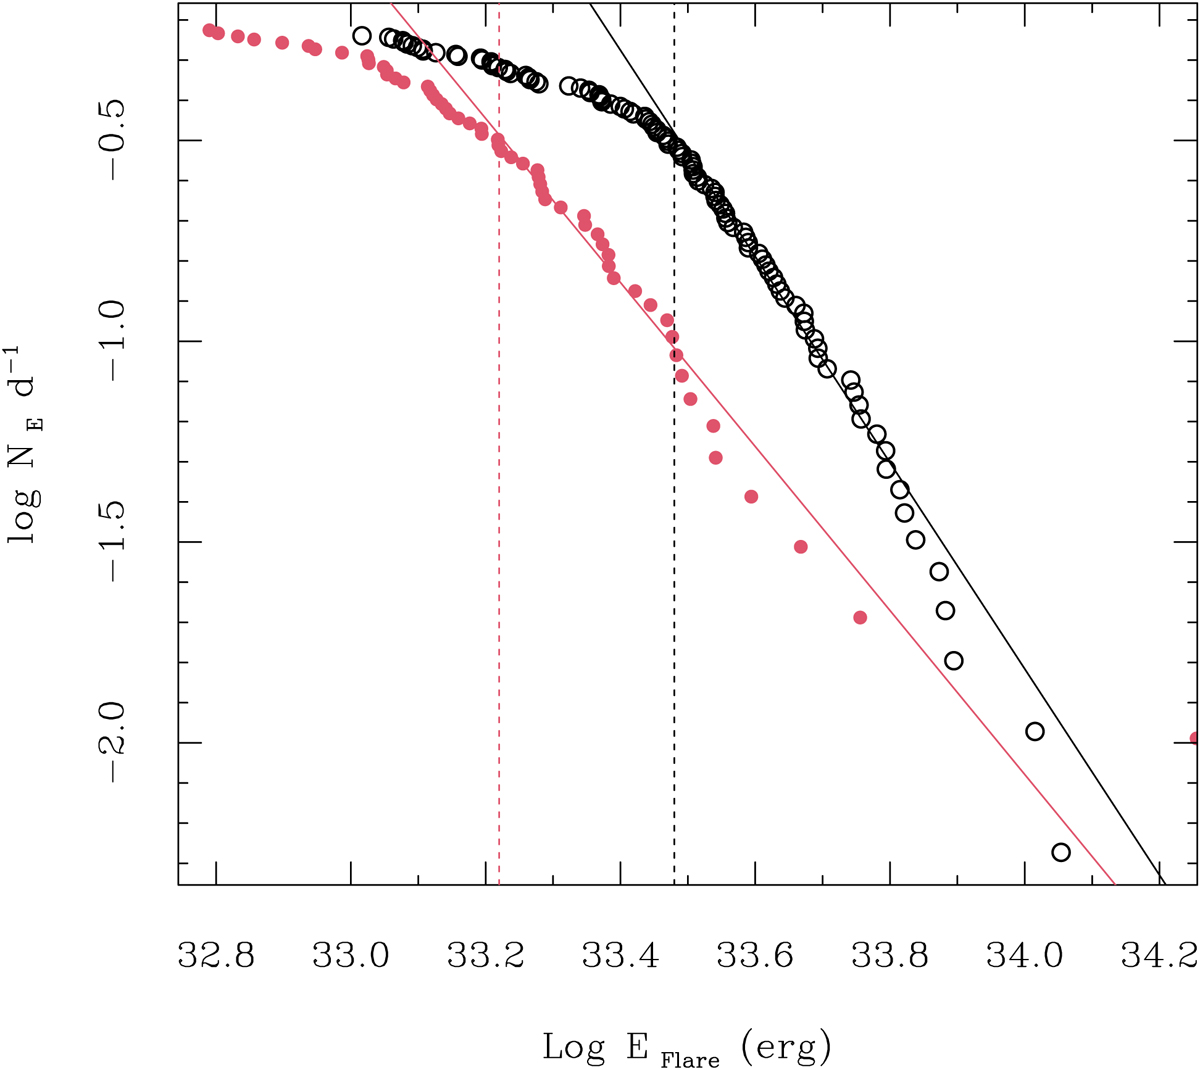
Fig. 6.
Download original image
Cumulative distributions of the rate of optical flares detected with TESS as a function of their energies. Black points and black lines refer to KELT-24, and red symbols and lines refer to WASP-18. The vertical lines mark the peak from the best fit to the histogram of flare energies (cf. Fig. 5). The fit to the points of the distributions above the knee are marked with solid lines. The slope is about −2.57 ± 0.04 (dN/dE ∝ E−1.57 ± 0.04) for KELT-24 and −2.04 ± 0.07 (dN/dE ∝ E−1.04 ± 0.07) for WASP-18.
Current usage metrics show cumulative count of Article Views (full-text article views including HTML views, PDF and ePub downloads, according to the available data) and Abstracts Views on Vision4Press platform.
Data correspond to usage on the plateform after 2015. The current usage metrics is available 48-96 hours after online publication and is updated daily on week days.
Initial download of the metrics may take a while.