Fig. 5.
Download original image
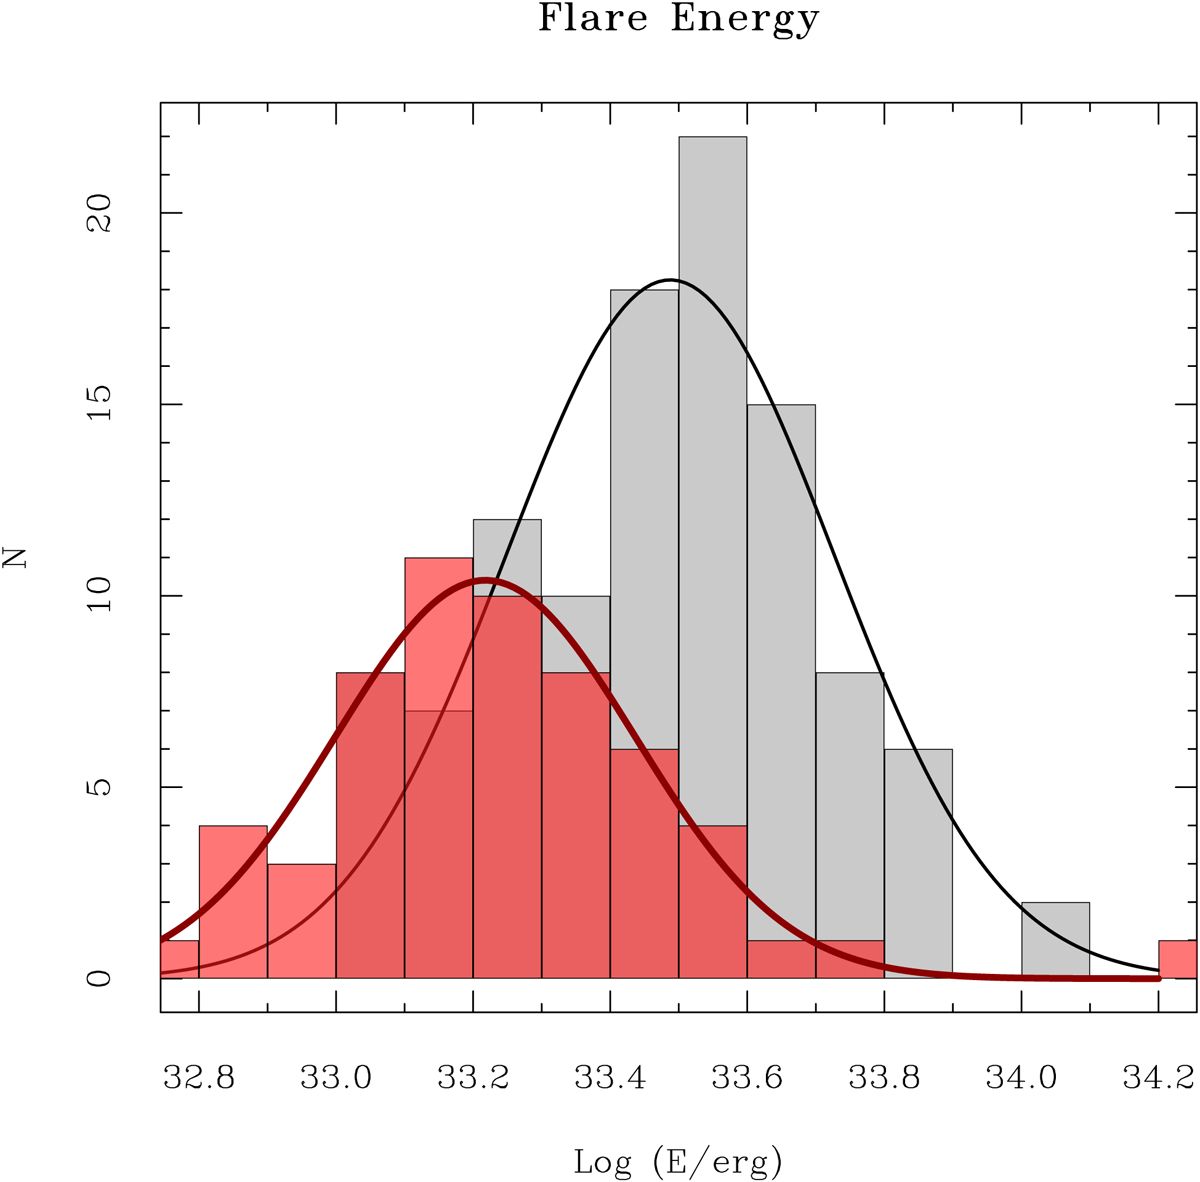
Histogram of energy of the optical flares detected in KELT-24 (gray histogram) and WASP-18 (red histogram). The histograms are modeled with log-normal distributions (smooth black and red lines) centered at log(E/erg)=33.48 for KELT-24 and log(E/erg)=33.22 for WASP-18 and with standard deviations of 0.34 dex and 0.31 dex, respectively.
Current usage metrics show cumulative count of Article Views (full-text article views including HTML views, PDF and ePub downloads, according to the available data) and Abstracts Views on Vision4Press platform.
Data correspond to usage on the plateform after 2015. The current usage metrics is available 48-96 hours after online publication and is updated daily on week days.
Initial download of the metrics may take a while.